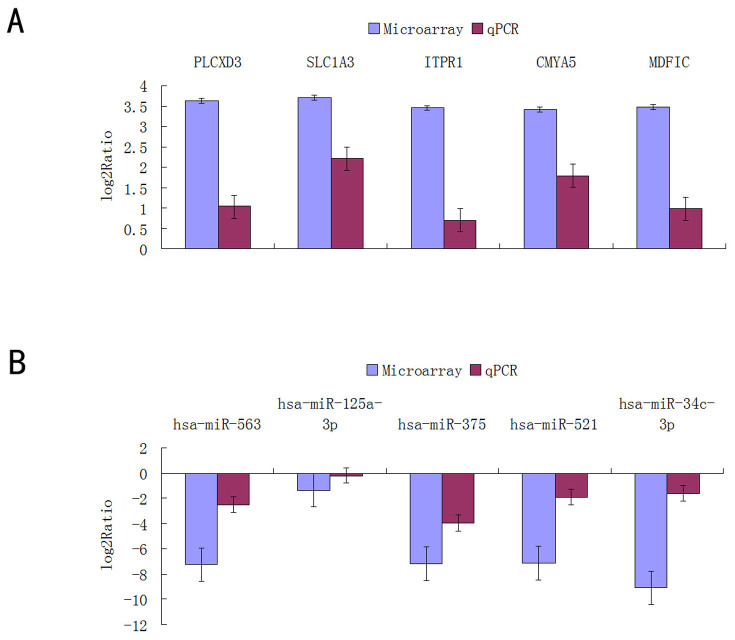
Figure 5. Comparison of the microarray and qPCR results for the mRNA (A) and miRNA genes (B).
Genes determined to be differentially expressed in all of the NOA patients by microarray analysis were validated by qPCR. The height of the columns in the chart represents the log-transformed average fold change in expression across the 4 patients for each of the validated genes; bars represent standard errors.

