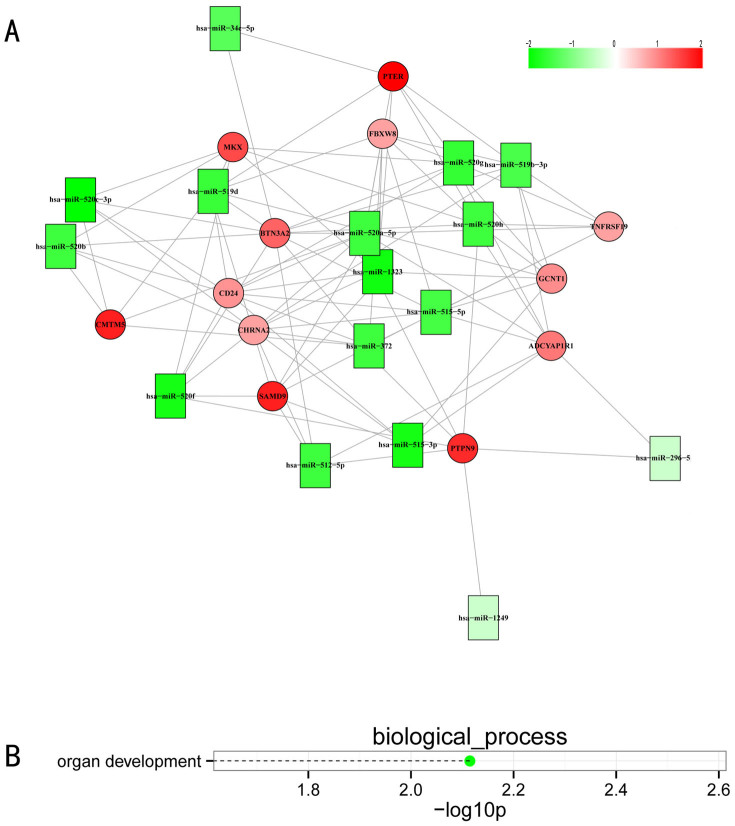
Figure 6. Visualization of a portion of the miRNA-regulated network (A) and of the involved GO biological processes (B).
Negatively correlated miRNA-mRNA interactions were visualized as a network using Cytoscape. This network gives, for the first time, a theoretical outline of the concerted action of regulating miRNAs and their potential target mRNAs in NOA. Red nodes represent miRNAs, green nodes represent miRNA targets, and the yellow edges represent protein-protein interactions (A). Dashed lines represent p-values for the ten top-ranked GO biological processes of the module (B). The p-values were calculated using hypergeometric tests and corrected by Benjamini-Hochberg adjustment. The p-values are expressed as the negative logarithm (base 10).

