
Figure 1.
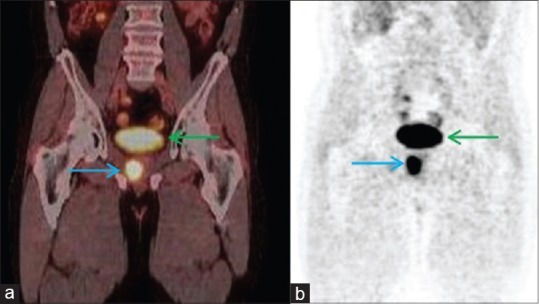
(a) The coronal 18F-fluorodeoxyglucose (18FDG)-positronemission tomography/computed tomography scans show, (blue arrow: Primary cancer, green arrow: Bladder FDG accumulation), SUVmax: 12.4, (b) maximum intensity projection images, (blue arrow: Primary cancer, green arrow: Bladder)