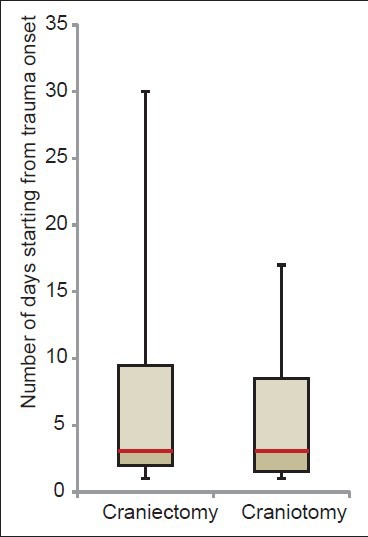
Figure 1.

Box plot showing the distribution of day of onset of seizures in postcraniotomy and postcraniectomy patients starting from the day of trauma onset. The center red line represents the median day of seizure onset (i.e. day 3) with adjacent box representing first and third quartiles of data. Wiskers represent the minimum and maximum values of collected data
