Figure 2.

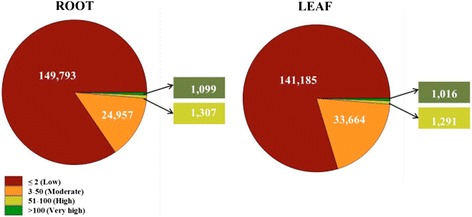
Expression profiling of W. somnifera . Root and leaf transcripts were classified as having low, moderate, high, or very high expression based on FPKM values.

Expression profiling of W. somnifera . Root and leaf transcripts were classified as having low, moderate, high, or very high expression based on FPKM values.