
Figure 2.
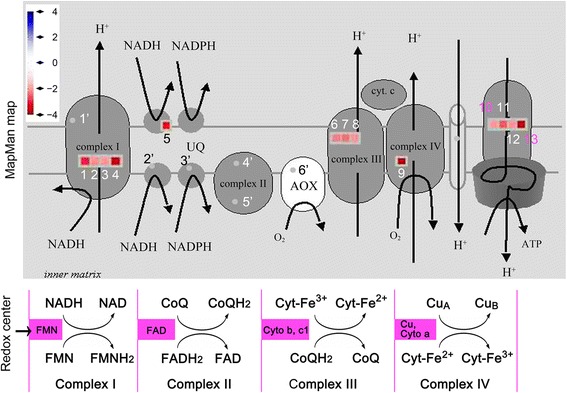
The effect of RfBP on METC gene expression. The MapMan program [85] was employed to analyze previously obtained data (http://www.ncbi.nlm.nih.gov/geo/query/acc.cgi?acc=GSE18417), show scaled reciprocal values of ratios of gene expression levels between RfBP+ and WT plants, and locate RfBP-affected genes with colored square patterns and other genes with grey dots in METC. Electron-carrier protein complexes and redox centers are indicated. In the MapMan map, RfBP-repressed genes are digitally coded (1–13) and the other genes are numbered with superscript commas. RfBP-repressed METC gene numbers 1–13 were used constantly in this figure and Figures 4, 5, and 10. See text for products encoded by METC genes.