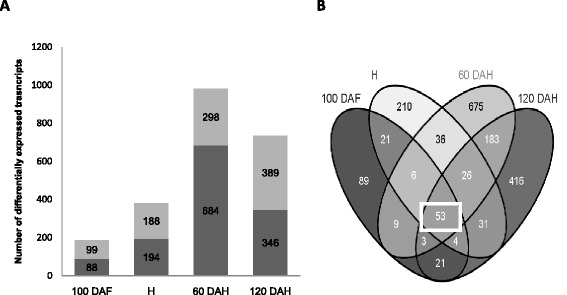
Figure 3.

Distribution of differentially expressed genes between mealy and non-mealy hybrids during kinetic of fruit maturation. A Histogram illustrating the number of significant differentially expressed genes between mealy (M74, M40) and non-mealy (M20, 49) hybrids during the fruit kinetic. In dark gray, genes are up-regulated in non-mealy hybrids; in soft grey, they are up-regulated in mealy hybrids. The number of genes per groups is shown. B Venn diagrams showing the overlap among kinetic time-point of all deregulated genes between mealy and non-mealy hybrids. The square points out the 53 genes deregulated during all kinetic.
