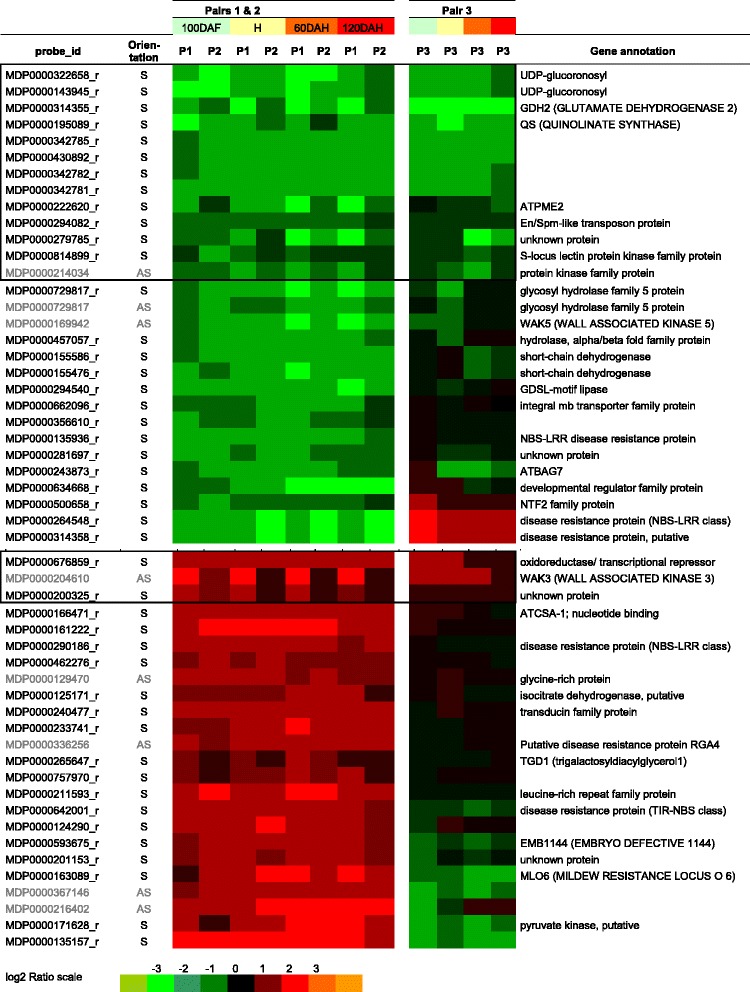
Figure 4.

Selection of differentially expressed genes involved in apple mealiness. 53 differentially expressed genes identified as displaying consistent profiles for the pairs M40/M49 (P1) and M74/M20 (P2) during all apple maturation are shown here. The pair M48/M16 (P3) was used to validate their expression patterns and to select few relevant genes (encircled by squares). Orientation indicates the orientation of the transcribed mRNA strand (S: sense; AS: antisense). The color scale (below) corresponds to log2 ratios between mealy versus non-mealy parenchyma transcript expression values (Red refers to up-regulated genes in mealy, green in non-mealy hybrids). The short gene annotations are based of Arabidopsis gene homologies.
