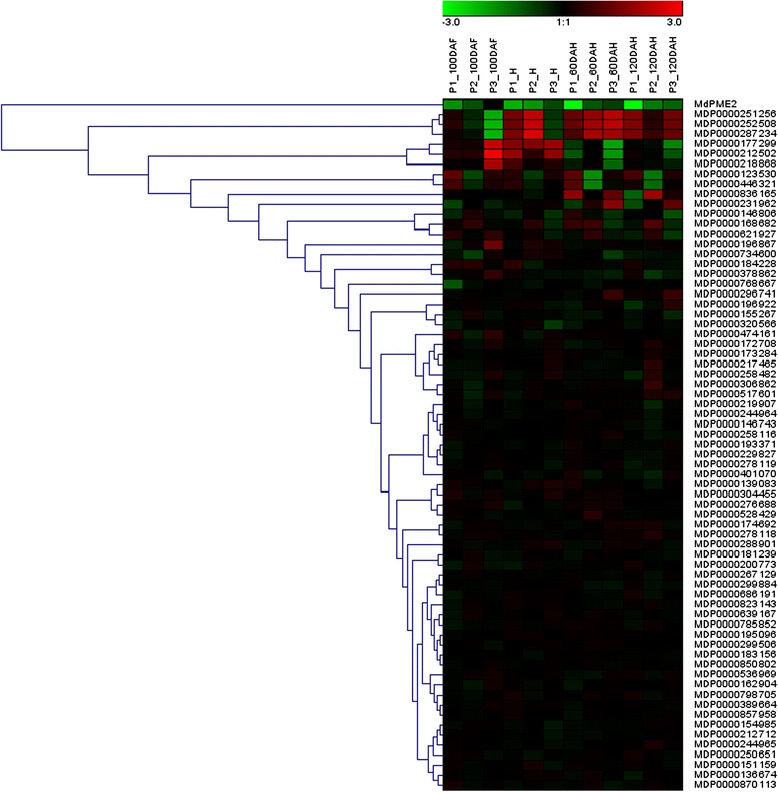
Figure 7.

Hierarchical cluster analysis of the 60 PMEs genes expressions in both 3 pairs of hybrids during complete fruit kinetic using Genesis software. Each row represents one PME gene. P1, P2 and P3 correspond to pairs M40/M49, M74/M20 and M48/M16 respectively. The MdPME2 gene only displayed an expression profile consistent with mealiness development.
