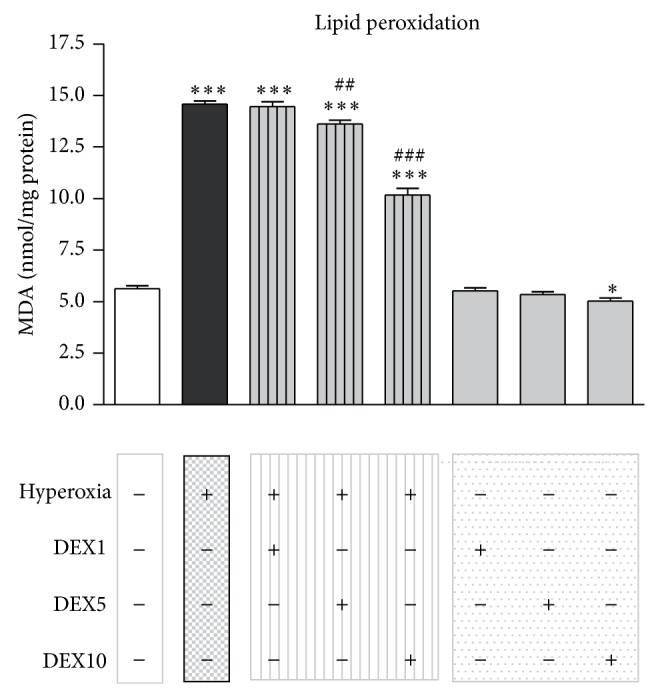
Figure 3.

Alteration of lipid peroxidation by hyperoxia in the immature brain. Hyperoxia lead to a significant increase of MDA levels after 24 h of oxygen exposure (black bar), whereas a single DEX application of 5 or 10 μg/kg (hatched grey bars) before hyperoxia exposure reduced these levels significantly. Bars represent mean + SEM, n = 6 per group, * P < 0.05 and *** P < 0.001 versus normoxia/control; ## P < 0.01 and ### P < 0.001 versus hyperoxia.
