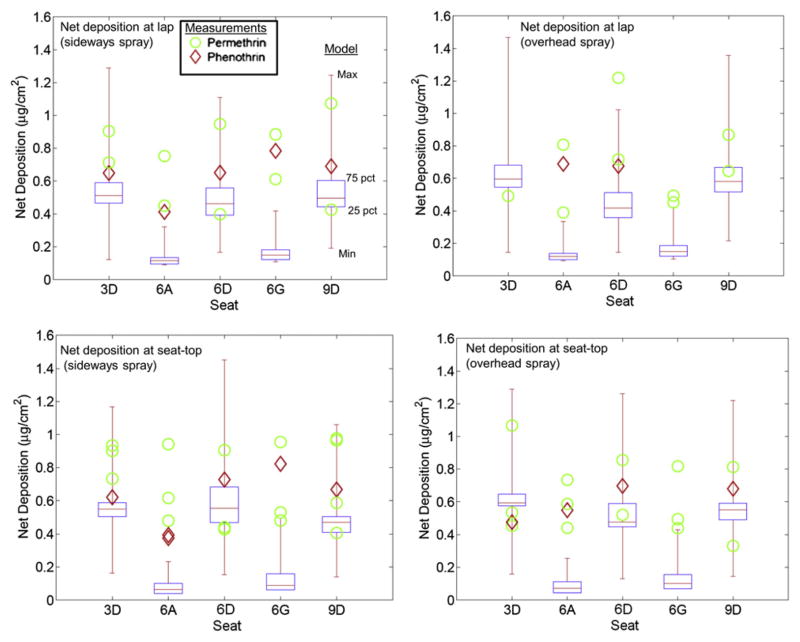
Fig. 7.
Comparison of CFD predictions (box plot) with experimental measurements for the low ventilation scenario (1 ACH). The CFD estimates over multiple, small cells at a given seat or lap are shown as a box plot, and the corresponding measurements are shown as points. Multiple measurement data points reflect duplicate measurements in an experiment, repeats of experiments, and experiments conducted with different type of pesticide.

