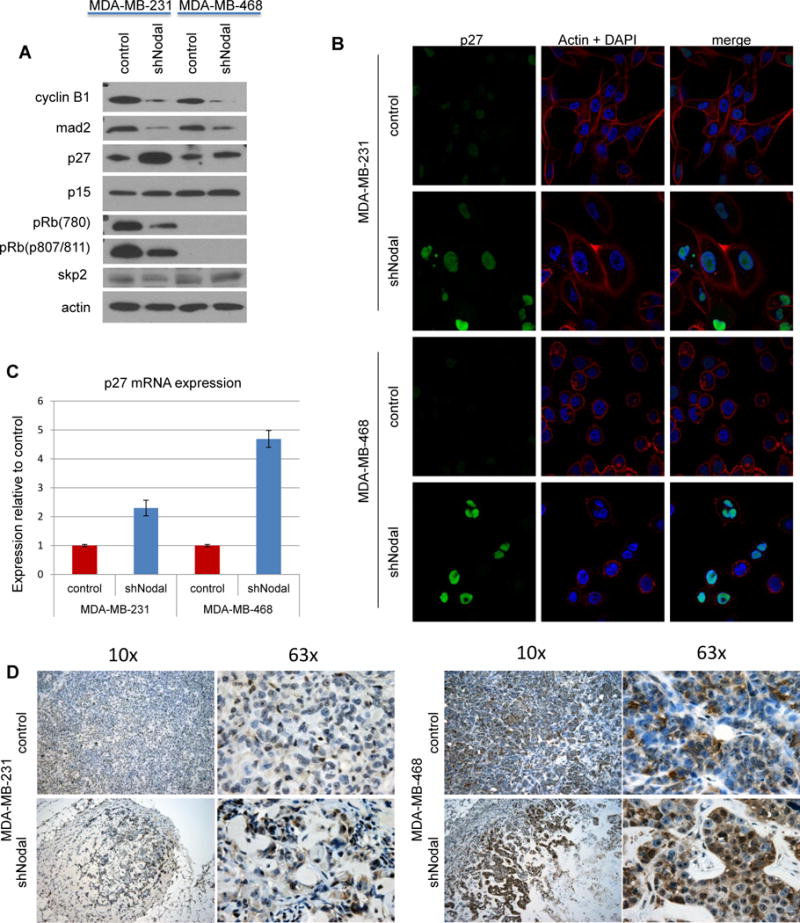
Figure 4.

Nodal knockdown cells are arrested in G1 with increased p27 expression. A) Western blot analysis of cell cycle regulatory protein levels. Data are representative of at least 3 experiments. B) Immunofluorescent analysis of p27 localization in breast cancer cells; p27 (green), actin (red) and DAPI (Blue) (40× original magnification). C) QPCR for p27 mRNA expression, normalized to controls. D) Nodal-knockdown and control xenograft tumors were stained for p27 (brown) and counterstained with hematoxylin. (original magnification 10× and 63×)
