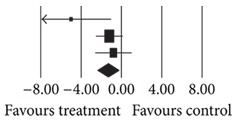
(b).
| Number | First author | Statistics for each study | Difference in means and 95% CI | Relative weight | ||||
|---|---|---|---|---|---|---|---|---|
| Difference in means | Standard error | Variance | Z value | P value | ||||
| 5 6 9 |
Wu (2008) [12] Baptista (2007) [13] Baptista (2006) [16] Total |
−5.000 −1.200 −0.800 −1.331 |
2.051 0.698 0.939 0.540 |
4.207 0.487 0.882 0.292 |
−2.438 −1.719 −0.852 −2.464 |
0.015 0.086 0.394 0.014 |

|
6.94 59.94 33.12 100.00 |
Heterogeneity: Q = 3.55; df = 2; P = 0.17; I 2 = 43.74.
