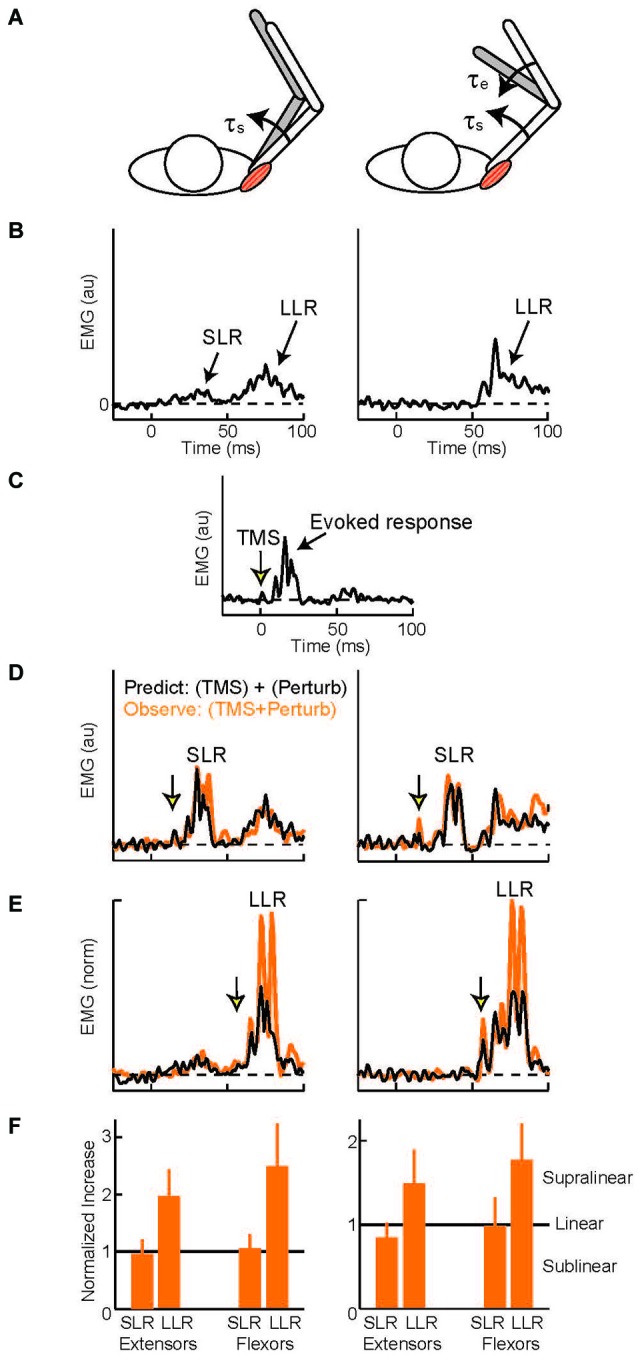
Figure 5.

Evoked muscle activity to perturbation torques and transcranial magnetic stimulation. (A) Torque perturbations applied to the arm, a shoulder flexion torque which displaced the shoulder joint (left cartoon) and shoulder + elbow flexion torque which only displaced the elbow (right cartoon). (B) Evoked activity of the shoulder extensor muscle during shoulder displacement (left panel) and pure elbow displacement (right panel), 0 ms is perturbation onset. Data from a representative subject (C) Evoked activity in the shoulder extensor to a single TMS pulse, 0 ms is TMS onset. (D) TMS pulse timed to occur during the SLR with shoulder displacement (left panel) and pure elbow displacement (right panel). Orange trace is the observed muscle activity to the combined stimulus; black trace is the predicted response, summed activity to the separate perturbation and TMS stimuli. (E) TMS pulse timed to occur during the LLR. Same format as above. (F) Group data for the two shoulder muscles. Data normalized to predicted response so values equal to 1 equal linearity whereas values above 1 indicate superlinearity and evidence of a common cortical circuit. Figure modified with permission from Pruszynski et al. (2011a).
