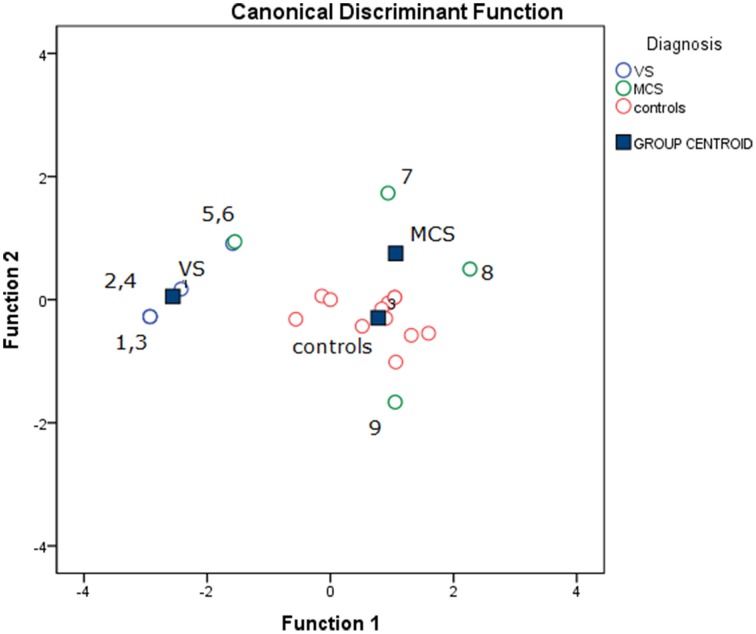
Figure 12.
Groups classification according to discriminant analysis, as showed in Table 3. Three centroids are reported for VS (Vegetative State), MCS (Minimal Conscious State) and controls. Single cases numbers are reported, according to Table 1. The discriminant functions were based in order on acoustic, electrical and visual N2-P2 amplitudes, while LEPs amplitude was excluded by step-wise leave one out method. (see Table 3).

