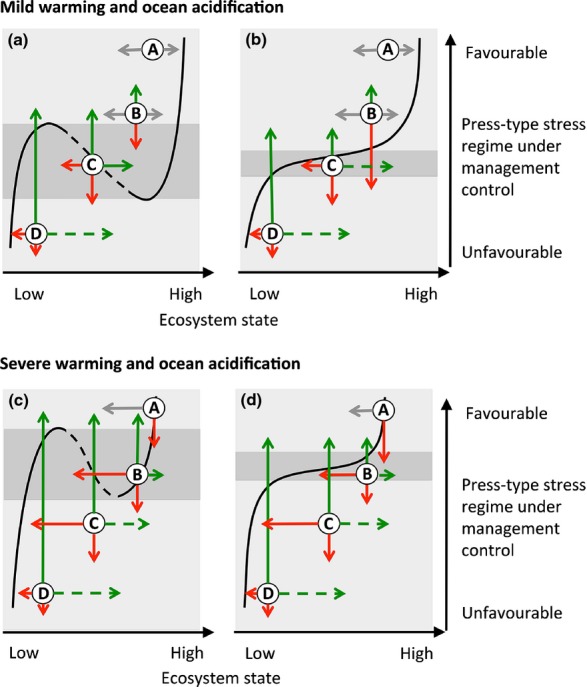
Fig 3.

Two-dimensional conceptual representation of system behaviour for the four environmental scenarios and resilience categories (a–d) in Fig.1, and management actions needed to improve system condition and resilience under mild and severe climate change and ocean acidification. Solid lines represent stable equilibria (basins of attraction) and the dashed line the unstable equilibrium (threshold). Grey arrows indicate perturbations or environmental changes that do not represent immediate risks. Red arrows are perturbations that can potentially lead to an unwanted phase shift or reinforce an already low (or degraded) ecosystem state, and green arrows are resilience-based management actions (see also text). The lengths of arrows indicate the severity of disturbances (press or pulse), propensity for recovery or efficacy of efforts needed to move the system to the safe side of a threshold. The grey areas represent the conditions where a pulse-type disturbance may trigger a phase shift. The figure is modified from Figs1 and 2 in Scheffer et al. (2001). Thresholds for regime shifts under ocean warming and acidification are guided by model simulations using GBR corals (Anthony et al., 2011).
