
Figure 13.
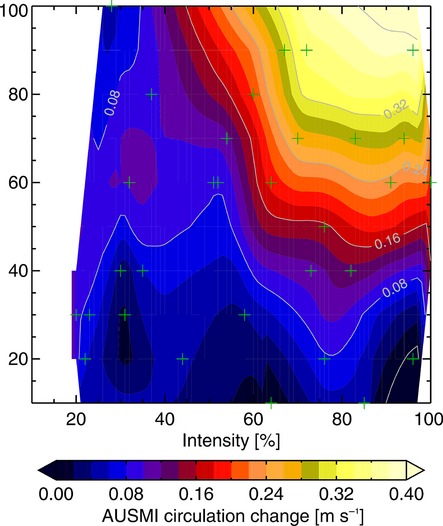
Simulated differences between the fire scenario and the reference simulation of the response of the Australian Monsoon Index (AUSMI) [m s−1] to variation in fire intensity and burned area. AUSMI is obtained by averaging the daily mean 850 hPa zonal wind speed from the equator to 10°S and from 120°E to 150°E, the zone of monsoonal reversal of the flow in and out of Australia. The crosses indicate the population of the simulation space consisting only experiments with a timing of the fire-event later than the Julian day 250 (7 September). The contoured response metric is then Gaussian low pass filtered linear interpolations based on Delauney triangulations. Reprinted from Lynch et al. (2007, p. 4).