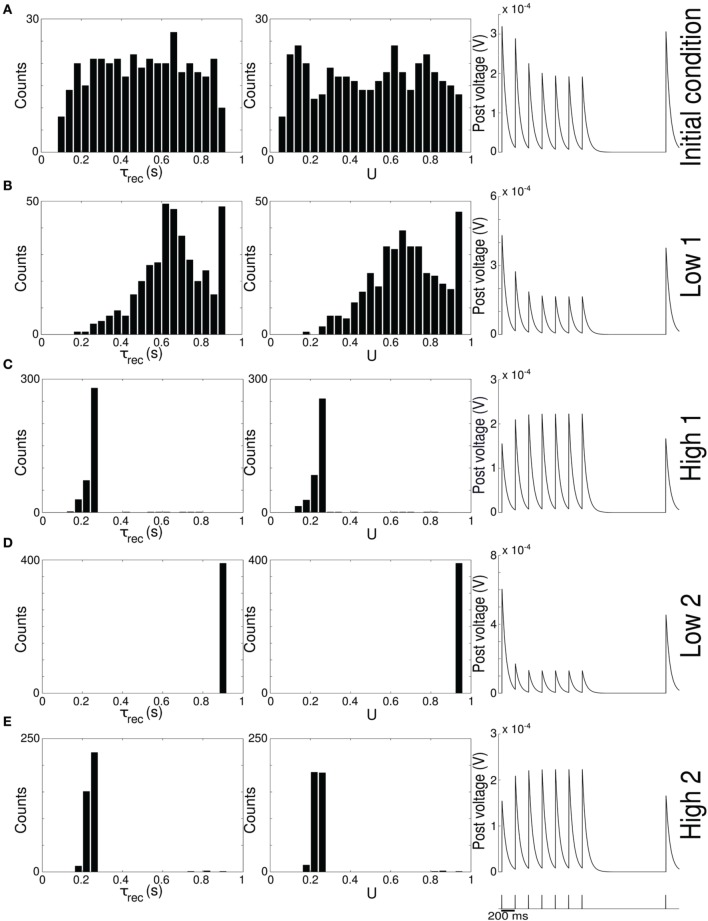
Figure 2.
Single population scenario: STP parameters distribution during adaptation with (U, τrec) learning scheme (Part 2). Different phases of the dynamics are represented. (A) Initial (uniformly random) condition. (B) End of low 1 phase (target rate is 5 Hz). (C) End of high 1 phase (30 Hz). (D) End of low 2 phase (5 Hz). (E) End of high 2 phase (30 Hz). Columns 1, 2 Histograms of recovery time constant and synaptic utilization of the synapses projecting onto the output neurons. Low values indicates facilitation whereas high values suggest depression. Column 3 Single synapse traces obtained with the TM model by applying a 5 Hz stimulus. Synaptic parameters used are mean values obtained from the distributions drawn in (A,B). Synapses display a clear alternation between depressing and facilitating behavior.

