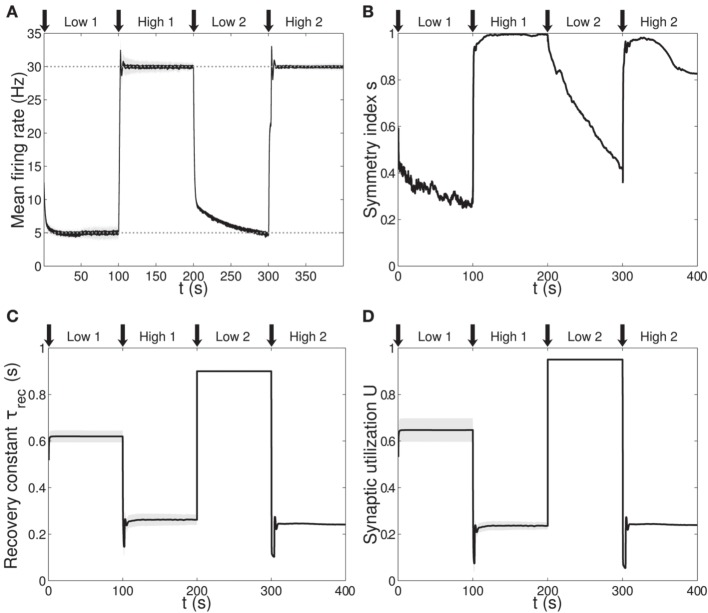
Figure 3.
Single population scenario: activity, connectivity and STP parameter adaptation in the output population with (U, τrec, A) learning scheme. (A) Mean firing rate of the output population. Shaded area represents standard deviation, horizontal dotted gray lines show the two target firing rates (high = 30 Hz, low = 5 Hz) and vertical black arrows mark the onset of the four dynamic phases alternating the targets in the sequence low-high-low-high. (B) Symmetry measure applied on the connectivity of the output population. In accordance with the target rate, connectivity switches between unidirectionality (low values) and bidirectionality (high values). (C,D) Mean values of recovery time constant τrec and synaptic utilization U for the synapses projecting onto the output neurons. We observe depression (high values) at low firing rates and facilitation (low values) at high firing rates. Compared to Figure 1, we observe an improvement in the overall performance due to the inclusion of the STP-dependent modification of A.

