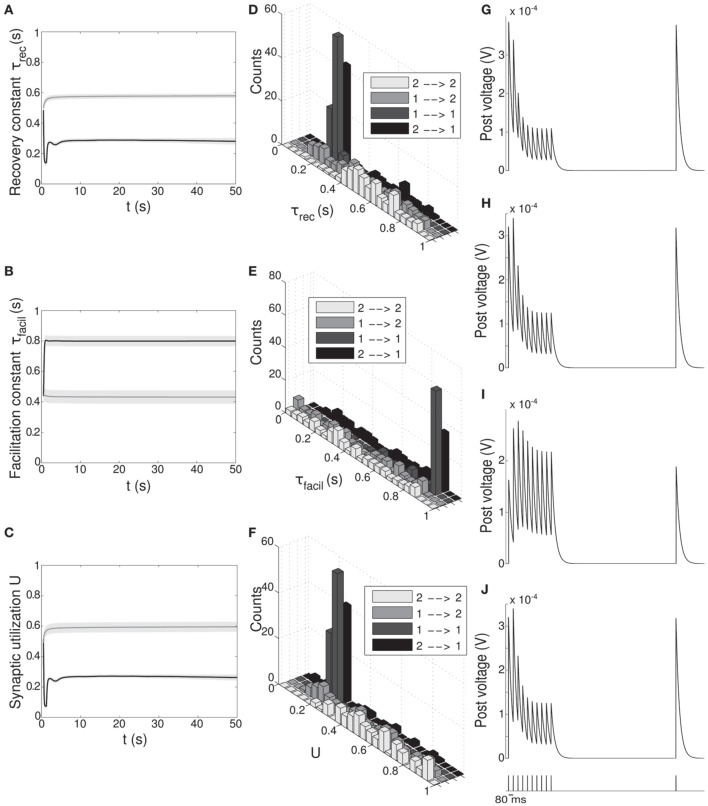
Figure 5.
Double population scenario: STP parameters adaptation and final distribution for the output populations with full (U, τrec, τfacil, A) learning scheme (Part 1). (A–C) Mean values of recovery time constant τrec, facilitation time constant τfacil and synaptic utilization U. Black lines represent mean values across the synapses projecting onto output population 1 from both output populations, ℘out1 ∪ ℘out2 → ℘out1, whereas gray lines describe the synapses projecting onto output population 2 from both output populations, ℘out1 ∪ ℘out2 → ℘out2. Shaded areas show standard deviation. We observe that the two populations develop different synaptic types, facilitating for ℘out1 and depressing for ℘out2. (D–F) Corresponding histograms of the three synaptic parameters at the end of the simulation. For each of them we show four different groups of values, mapping qualitatively to the four subtypes identified by Wang et al. (2006), see Table 3. Light gray: ℘out2 → ℘out2 (E2a). Medium gray: ℘out1 → ℘out2 (E2b). Dark gray: ℘out1 → ℘out1 (E1a). Black: ℘out2 → ℘out1 (E1b). (G–J) Single synapse traces obtained with the TM model by using a 12 Hz stimulus. Each panel represents a different subtype of synapses. (G) ℘out2 → ℘out2. (H) ℘out1 → ℘out2. (I) ℘out1 → ℘out1. (J) ℘out2 → ℘out1. Synaptic parameters used are the mean values obtained from the distributions drawn in (D–F). A comparison with (Wang et al., 2006) on the basis of the traces only shows that we are able to identify three of the four subtypes.

