Figure 6.
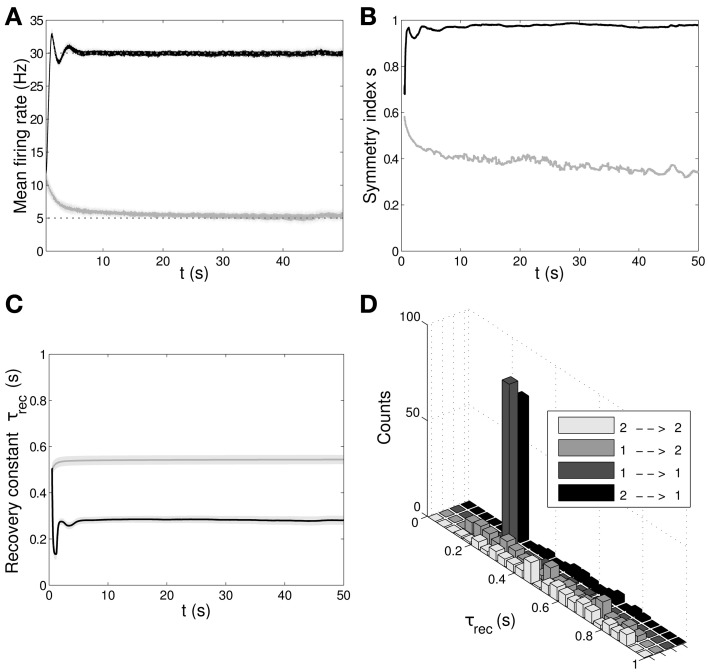
Double population scenario: learning in the output populations with minimal (τrec, A) model. (A) Mean firing rate of the output populations, black line for ℘out1 and gray line for ℘out2. Shaded area represents standard deviation and horizontal dotted gray lines show the two target firing rates (30 Hz for ℘out1, 5 Hz for ℘out2). (B) Symmetry measure applied on the connectivity of the output population. Color legend as in (B). Connectivity evolves differently in the two populations, leading to a bidirectional motif in ℘out1 and to a unidirectional motif in ℘out2. (C) Mean value of recovery time constant τrec. Black line: ℘out1 ∪ ℘out2 → ℘out1. Gray line: ℘out1 ∪ ℘out2 → ℘out2. We observe that the two populations develop different type of synapses, facilitating for ℘out1 and depressing for ℘out2. (D) Corresponding histograms of the recovery time constant at the end of the simulation. Light gray: ℘out2 → ℘out2, medium gray: ℘out1 → ℘out2, dark gray: ℘out1 → ℘out1, black: ℘out2 → ℘out1. The panels show that the achievement of the tasks and the differentiation of the synapses is still possible with this minimal model.

