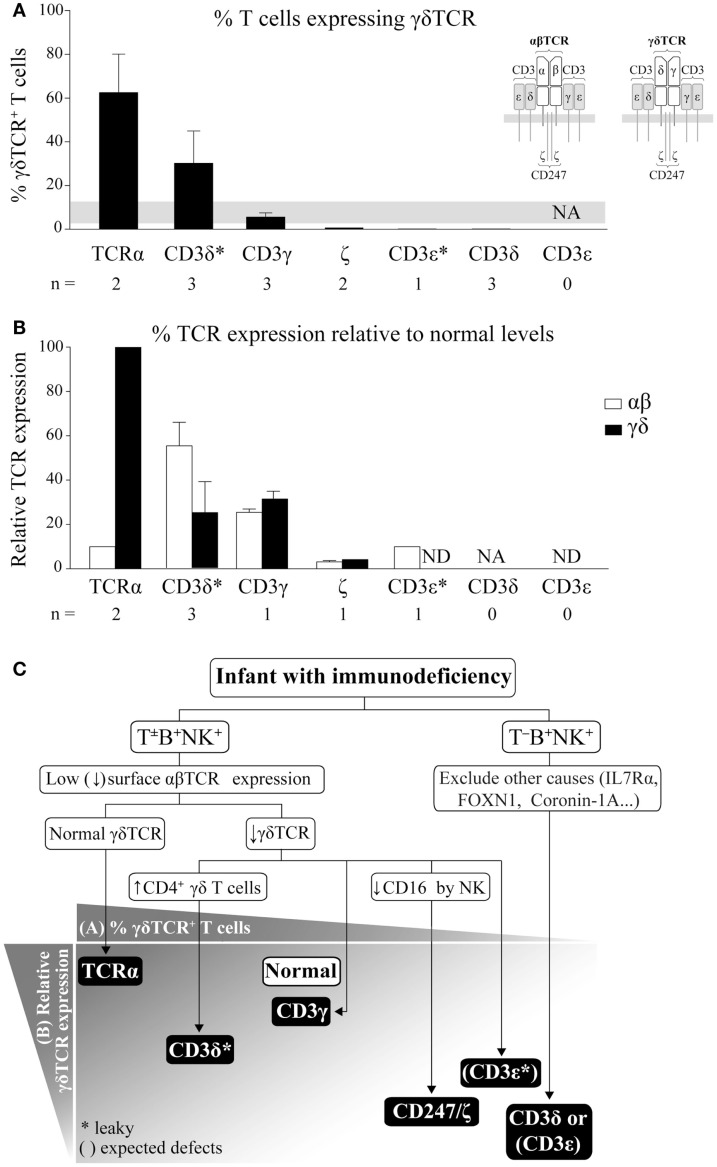
Figure 1.
γδ T cells in TCRID. (A) Proportion of γδ T cells within the T cell compartment. The percentage of γδ T cells (mean ± SEM) was defined as γδTCR+ using 11F2, IMMU510, or anti-TCRδ-1 monoclonal antibody (mAb) within the T lymphocyte gate (defined as CD3+) and ordered from left to right in decreasing values. The gray band indicates the normal range for infants (8). Inset: human TCR isotypes. NA: not analyzable (no T cells); *: leaky mutations (partial defects); n: number of patients for which data was available. (B) % TCR surface expression (mean ± SEM) in γδ or αβ T cells relative to healthy donors. TCR surface expression was determined by flow cytometry using different anti-CD3 mAb, γδ T cells were identified as in (A) and αβ T cells as γδTCR−CD3+ or CD4+ cells. ND: not determined. (C) Our suggested TCRID diagnostic flowchart using absolute lymphocyte counts for T−B+NK+ or T±B+NK+ phenotype and basic flow cytometry data (top) to point to the most likely culprit TCR chain (bottom). TCR chains are represented by black boxes arranged according to the proportion of γδ T cells from (A) and their surface TCR expression relative to normal controls from (B). The white box indicates normal value. *: as in (A). Brackets represent expected defects, as γδ T cells values were not available in these TCRID.

