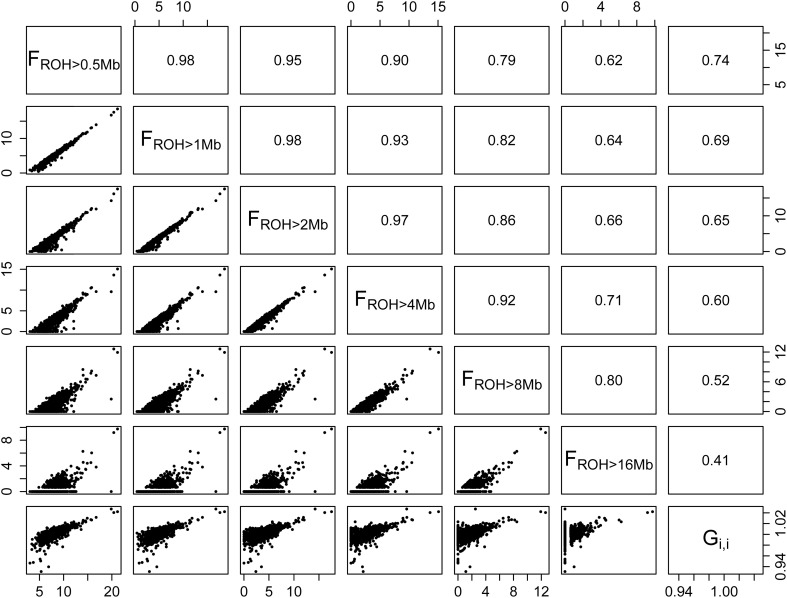
Figure 2.
Scatterplots (lower panel) and correlations (upper panel) of percentage of autosomal genome coverage by runs of homozygosity (FROH) of different minimum lengths (>0.5, >1, >2, >4, >8, and >16 Mb) and diagonal elements of the realized genomic relationship matrix (Gi, i). The last column of panels on the right indicates that the correlation between FROH and Gi, i decreases as a function of minimum fragment size.

