
Figure 5.
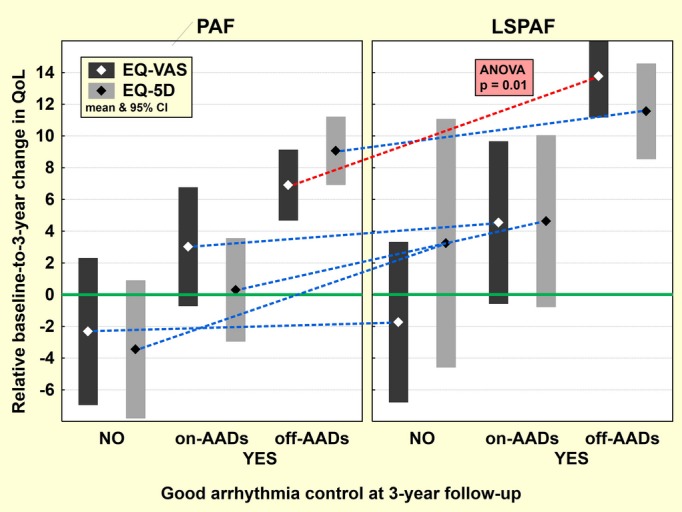
Relative change in quality of life in subgroups by final good arrhythmia control. Relative baseline–to–3‐year change in both QoL measures (EQ‐VAS and EQ‐5D) for patients with paroxysmal AF (PAF) and long‐standing persistent AF (LSPAF) is shown for 3 subgroups composed according to good arrhythmia control (off drugs/on drugs/absent) at the end of follow‐up. Points and bars represent mean and 95% CI. 5D indicates 5‐dimensional descriptive system; AADs, antiarrhythmic drugs; AF, atrial fibrillation; QoL, quality of life; EQ, European Quality of Life Group; VAS, visual analog scale.