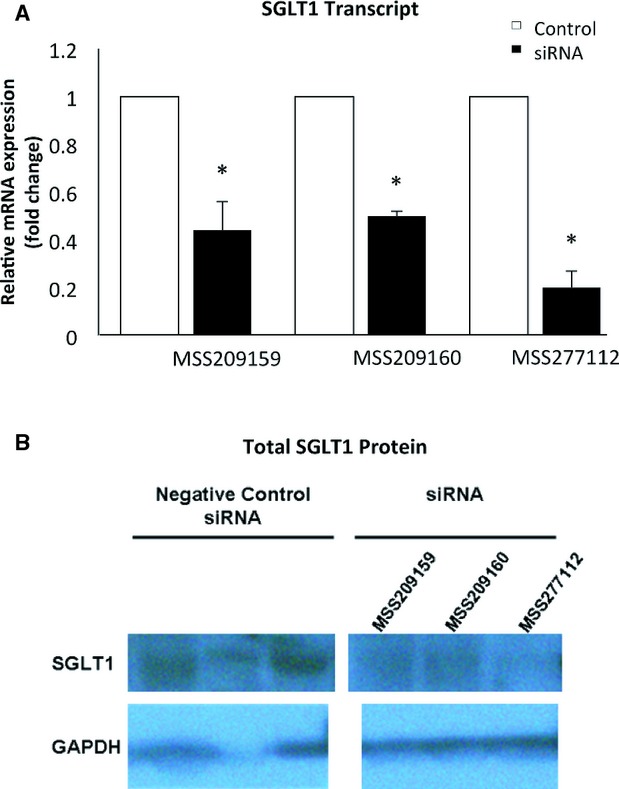
Figure 1.

Real‐time quantitative PCR (A) and immunoblots (B) of SGLT1 in HL‐1 cardiomyocytes treated with different siRNAs (Invitrogen). *P<0.01 vs negative control siRNA. PCR indicates polymerase chain reaction; SGLT1, sodium‐dependent glucose co‐transporter 1.
