Figure 4.
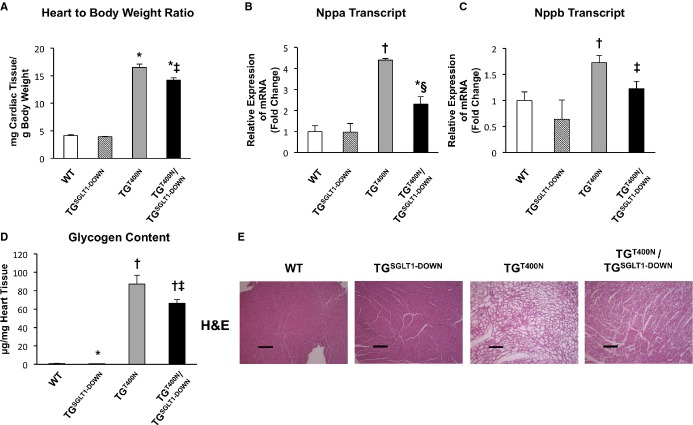
At 5 to 7 weeks of age, relative to TGT400N mice, TGT400N/TGSGLT1‐DOWN mice exhibited decreased heart‐to‐body‐weight ratios (A), downregulation of hypertrophic markers Nppa (B) and Nppb (C), and decreased cardiac glycogen content (D). The decreased cardiac glycogen content was reflected on cardiac histopathology with hematoxylin and eosin (H&E) staining showing a decrease in glycogen‐containing vacuoles in TGT400N/TGSGLT1‐DOWN relative to TGT400N mice (E). QPCR: WT, N=4; TGSGLT1‐DOWN, N=3; TGT400N, N=5; TGT400N/TGSGLT1‐DOWN, N=7. Heart‐to‐body‐weight ratio: WT, N=5; TGSGLT1‐DOWN, N=6; TGT400N, N=7; TGT400N/TGSGLT1‐DOWN, N=7. Glycogen content: WT, N=11; TGSGLT1‐DOWN, N=17; TGT400N, N=12; TGT400N/TGSGLT1‐DOWN, N=17. *P<0.05 vs WT; †P<0.005 vs WT; ‡P<0.05 vs TGT400N; §P<0.01 vs TGT400N. Data are expressed as mean±SE. Bar=2 μm. QPCR indicates quantitative polymerase chain reaction; SGLT1, sodium‐dependent glucose co‐transporter 1; WT, wildtype.

