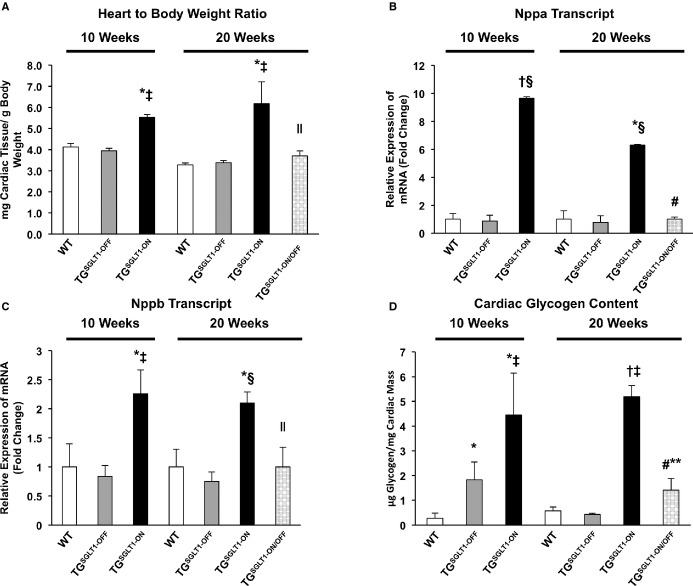
Figure 8.
TGSGLT1‐ON mice exhibited increases relative to WT mice in heart‐to‐body‐weight ratio (A), glycogen content (B), and markers of cardiac hypertrophy (C and D) at 10 and 20 weeks of age. There was a significant reduction in heart‐to‐body‐weight ratio, glycogen content, and markers of hypertrophy in TGSGLT1‐ON/OFF relative to TGSGLT1‐ON mice at age 20 weeks. Heart‐to‐body‐weight ratio: WT, N=4; TGSGLT1‐OFF, N=4;TGSGLT1‐ON, N=3; TGSGLT1‐ON/OFF, N=4. Glycogen content and QPCR at 10 weeks: WT, N=5; TGSGLT1‐OFF, N=4; TGSGLT1‐ON, N=4. Glycogen content and QPCR at 20 weeks: WT, N=5; TGSGLT1‐OFF, N=4; TGSGLT1‐ON, N=3; TGSGLT1‐ON/OFF, N=4. *P<0.05 vs WT; †P<0.005 vs WT; ‡P<0.05 vs TGSGLT1‐OFF; §P<0.005 vs TGSGLT1‐OFF; ∥P<0.05 vs TGSGLT1‐ON; #P<0.005 vs TGSGLT1‐ON; **P<0.01 TGSGLT1‐ON (10 weeks) vs TGSGLT1‐ON/OFF. Data are expressed as mean±SE. QPCR indicates quantitative polymerase chain reaction; SGLT1, sodium‐dependent glucose co‐transporter 1; WT, wildtype.

