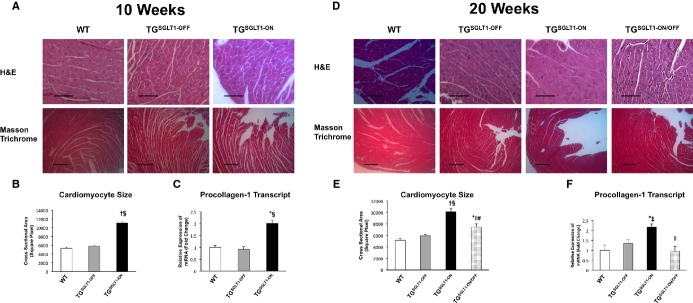
Figure 9.

Histopathological changes at 10 and 20 weeks of age. A and D, Representative transverse sections of left ventricular tissue stained with hematoxylin and eosin (H&E) (top row) and Masson trichrome (bottom row) obtained from WT, TGSGLT1‐OFF, TGSGLT1‐ON, and TGSGLT1‐ON/OFF mice. Fibrosis, sarcoplasmic inclusions, and increased nuclear size were evident in TGSGLT1‐ON mice compared to WT, TGSGLT1‐OFF, and TGSGLT1‐ON/OFF mice. B and E, Histomorphometric assessment showed an increase in myocyte size in TGSGLT1‐ON mice compared to WT and TGSGLT1‐OFF mice. In addition, TGSGLT1‐ON/OFF mice showed reduced myocyte size compared to both 10‐ and 20‐week‐old TGSGLT1‐ON mice. N=25/group. C and F, QPCR showed an increase in collagen expression in TGSGLT1‐ON mice compared to WT and TGSGLT1‐OFF mice. TGSGLT1‐ON/OFF mice showed a reduction in collagen expression compared to 20‐week‐old TGSGLT1‐ON mice. QPCR at 10 weeks: WT, N=5; TGSGLT1‐OFF, N=4; TGSGLT1‐ON, N=4. QPCR at 20 weeks: WT, N=5; TGSGLT1‐OFF, N=4; TGSGLT1‐ON, N=3; TGSGLT1‐ON/OFF, N=4. *P<0.05 vs WT; †P<0.001 vs WT; ‡P<0.05 vs TGSGLT1‐OFF; §P<0.001 vs TGSGLT1‐OFF; ∥P<0.01 vs 20‐week‐old TGSGLT1‐ON; #P<0.001 vs10‐week‐old TGSGLT1‐ON. Data are expressed as mean±SE. H&E bar=3 μm; trichrome bar=1 μm. QPCR indicates quantitative polymerase chain reaction; SGLT1, sodium‐dependent glucose co‐transporter1; WT, wildtype.
