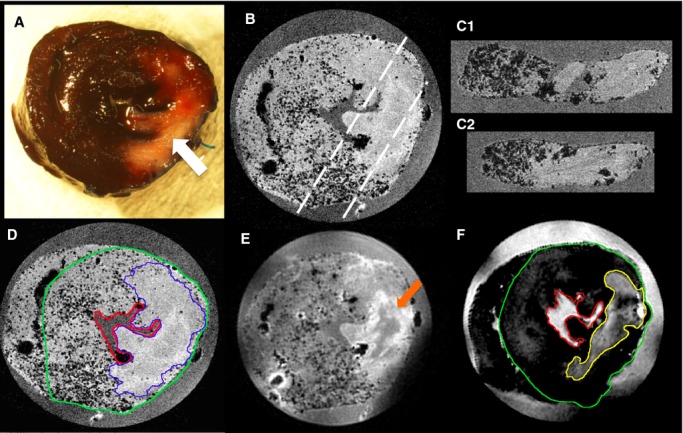
Figure 2.

Visual comparison of traditional Evan's Blue/TTC and novel high‐field MRI technique for defining myocardial salvage zone. A, Photograph of sliced rat heart prepared using standard Evan's Blue TTC technique. The AAR is determined as the region of the heart that is not stained blue by Evan's Blue dye. Within the AAR the MI zone is seen as the central white zone (white arrow). The pink/red zone within the AAR defines the viable myocardium stained by TTC. Slice thickness is ≈2 mm. B, 3DGE (TE 4 ms) image of the same representative slice shown in A, illustrating the perfused myocardium appearance containing numerous signal voids (black dots), and clear delineation of perfused and nonperfused myocardium. Resolution: 81 μm3. The dashed white lines indicate the reformatted slices C1 and C2. D, 3DGE image of same slice with TE=8 ms showing increased T2* contrast within the perfused territory from the MPIOs (border zone of AAR delineated by blue line). Resolution: 81 μm3. E, Spin echo MRI image (TE=42 ms, TR=600 ms) of same slice highlighting T2 contrast within the MI zone, while also showing signal voids from MPIO. Some low‐intensity signal (orange arrow) can be seen centrally within the MI zone likely secondary to microvascular obstruction. Resolution: 120 μm3. F, Inversion recovery image of the same slice shown in E, highlighting the T1 contrast caused by gadolinium within the MI zone (yellow line). Resolution: 163×325×400 μm. The LV epicardial contour is shown in D and F by a green line and the endocardial surface by a red line. AAR indicates area at risk; DGE, delayed gadolinium enhanced; LV, left ventricular; MI, myocardial infarction; MPIO, microparticles of iron oxide; MRI, magnetic resonance imaging; TE, echo time; TTC, triphenyl tetrazolium chloride.
