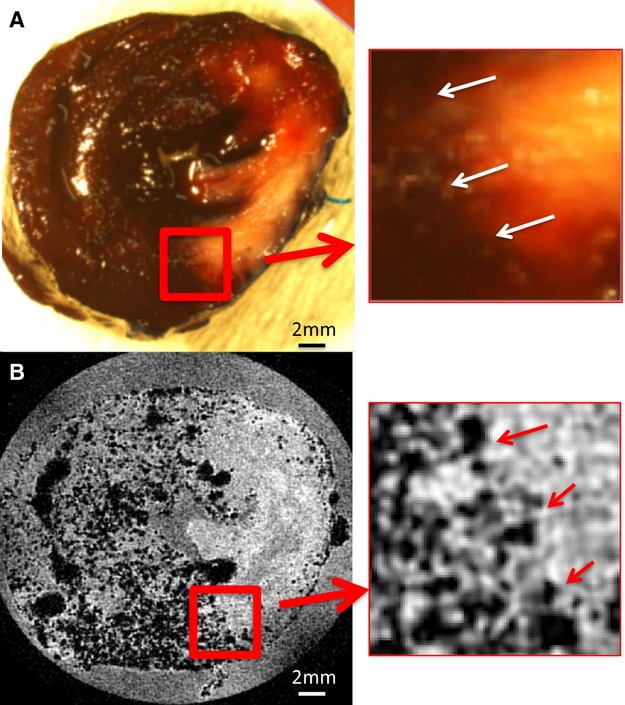
Figure 4.

Comparison between the borderzone definition of the AAR using Evan's Blue (A) and MPIO (B). The edge definition (white arrows, A; red arrows, B) using Evan's Blue appears indistinct due to diffusion of the stain and the reduced contrast between Evan's Blue–positive area and the TTC‐positive staining. In contrast, the particulate nature of the MPIO, and the T‐weighted image acquisition, create a sharp definition of the border between the AAR and the perfused territory. Insets show magnified image. Two millimeter magnified views are provided to the right of A and B. AAR indicates area at risk; MPIO, microparticles of iron oxide; TTC, triphenyl tetrazolium chloride.
