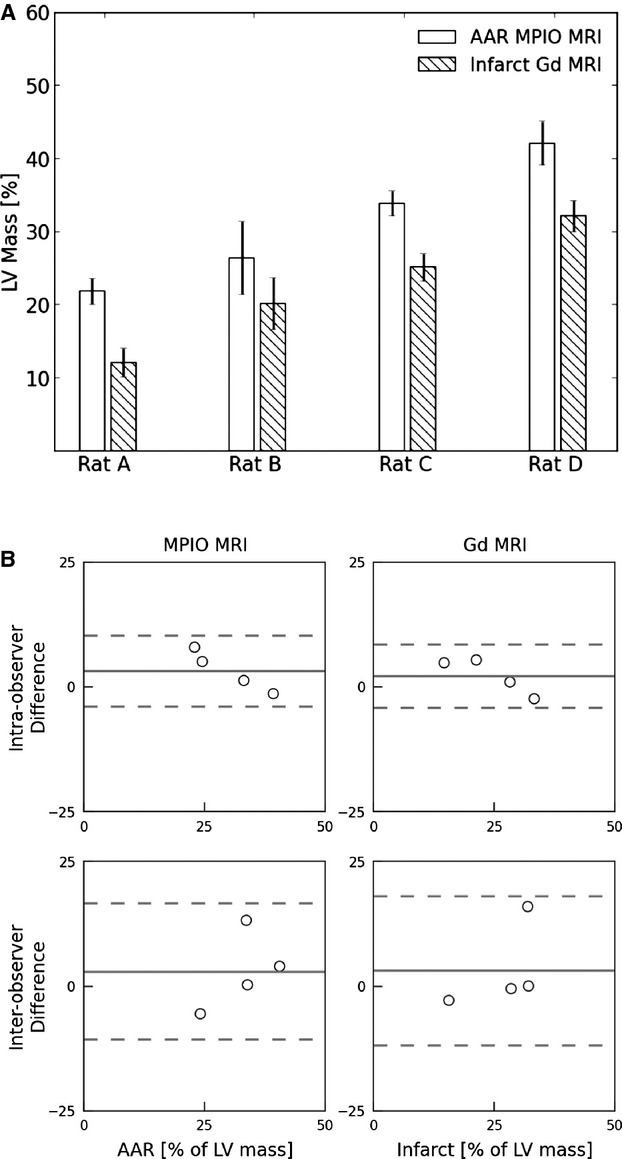
Figure 7.

Summary of AAR and MI measurements in whole rat hearts (n=4 readers) following IR using the MPIO/Gd MRI method. A, AAR and infarct zones (expressed as a percentage of LV myocardial mass ±SEM). B, Bland‐Altman plots examining the intra‐observer (top 2 panels) and interobserver (bottom 2 panels) variability for determination of AAR (left) and MI zones (right). The dashed lines represent the 95% level of agreement. AAR indicates area at risk; LV, left ventricular; MI, myocardial infarction; MPIO/Gd, microparticles of iron oxide/gadolinium; MRI, magnetic resonance imaging; IR, ischemia–reperfusion.
