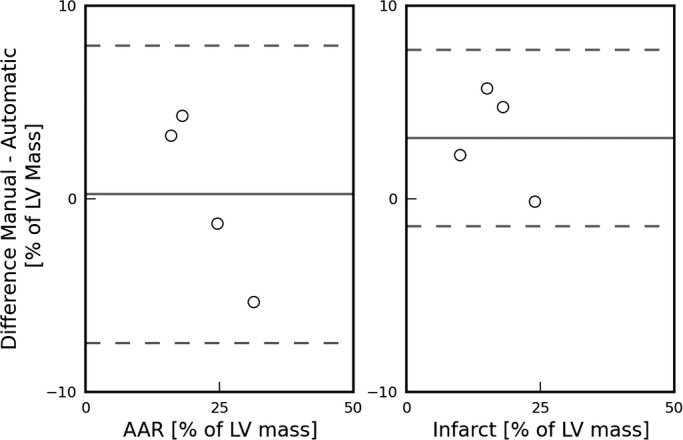
Figure 9.

Bland‐Altman plots comparing manual and automatic detection of the AAR (left) and MI (right) zones in intact (nonsliced) rat heart (n=4) using the MPIO/Gd technique. The dashed lines represent the 95% level of agreement. AAR indicates area at risk; MI, myocardial infarction; MPIO/Gd, microparticles of iron oxide/gadolinium.
