
Figure 4.
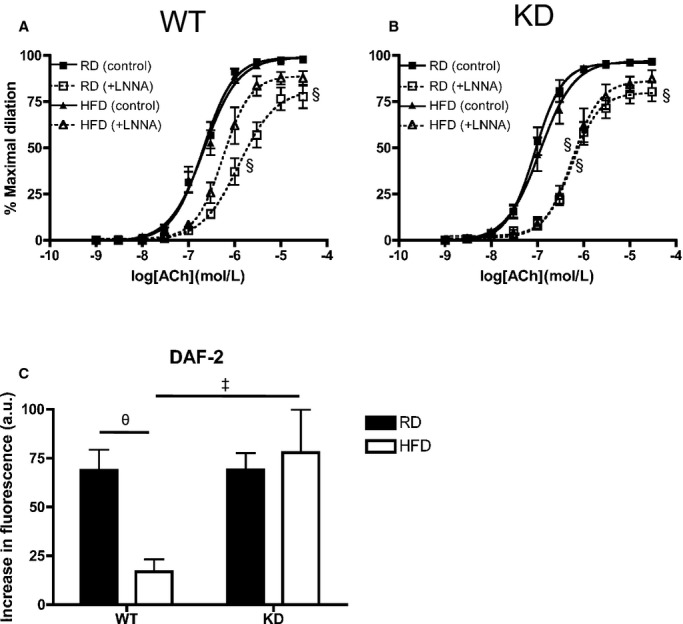
Vascular reactivity as measured by ACh‐mediated dilation in femoral arteries under no‐drug control condition and with LNNA of 6‐month‐old (A) WT (n=7 to 10) and (B) angptl2 KD (n=9 to 13) mice fed an RD or HFD. The Kruskal–Wallis test followed by the Dunn's posttest were used for data sets not normally distributed. §P<0.05 vs control. C, Production of NO was measured by loading femoral arteries with DAF‐2 with average increases in fluorescence intensities during addition of 10 μmol/L ACh (n=6). The z‐score method followed by the d'Agostino–Pearson omnibus test was used to test normality of data sets, after which the 2‐way ANOVA followed by the Bonferonni posttest were used. ‡P<0.05 vs WT; θP<0.05 vs RD. ACh indicates acetylcholine; DAF‐2, 4,5‐diaminoflorescein diacetate; HFD, high‐fat diet; KD, knockdown; LNNA, Nω‐nitro‐l‐arginine; NO, nitric oxide; RD, regular diet; WT, wild‐type.