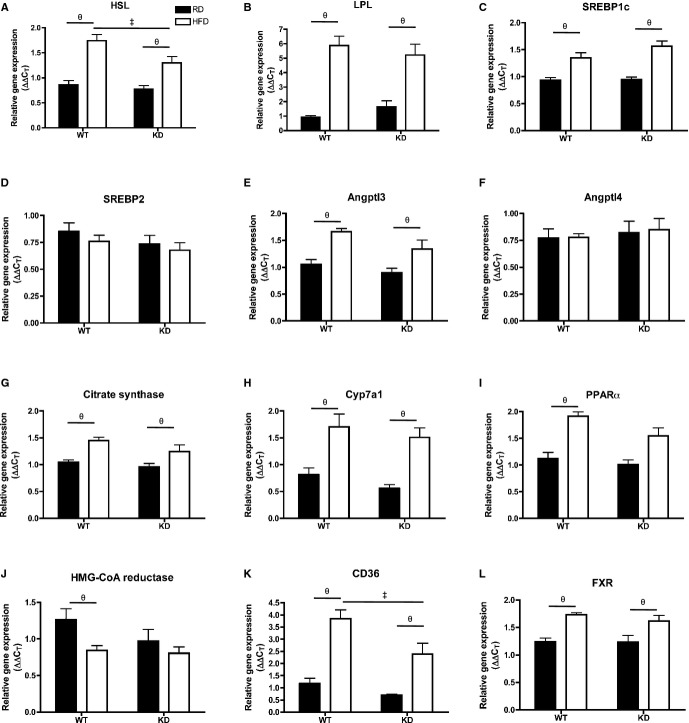
Figure 10.
A through L, Expression of genes coding for proteins involved in lipid metabolism regulation in the liver by qPCR; n=6 to 7. Data sets were tested for normality using the z‐score method and the d'Agostino–Pearson omnibus test, after which 2‐way ANOVA followed by the Bonferroni posttest was used. All except I passed the normality test, where the Krustal–Wallis followed by Dunn's posttest were used. ‡P<0.05 vs WT; θP<0.05 vs RD. FXR indicates farnesoid X receptor; HFD, high‐fat diet; HMG‐CoA, 3‐hydroxy‐3‐methylglutaryl coenzyme‐A; HSL, hormone‐sensitive lipase; KD, knockdown; LPL, lipoprotein lipase; PPAR, peroxisome proliferator‐activated receptor; qPCR, quantitative polymerase chain reaction; RD, regular diet; SREBP, sterol regulatory element binding protein.

