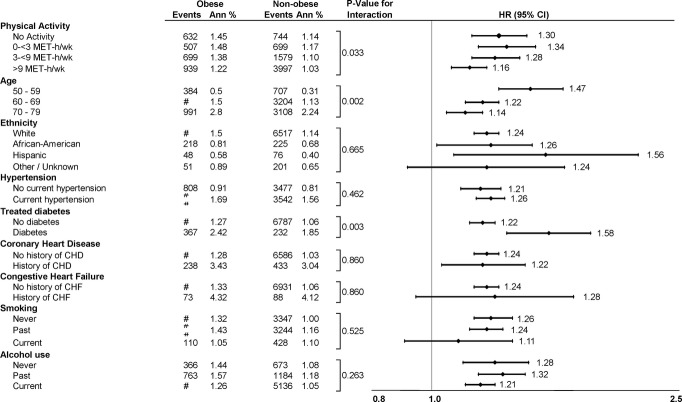
Figure 1.
Hazard ratios of incident atrial fibrillation by subgroup of body mass index (obese vs. overweight plus normal weight participants). Hazard ratios are multivariate adjusted for all covariates in the primary model. P values for continuous variables (physical activity, age) are done with separate interaction models of obese (yes/no) versus linear trend across level. CHD indicates coronary heart disease; CHF, congestive heart failure; CI, confidence interval; HR, hazard ratio; MET‐h/wk, metabolic equivalent task hours per week.

