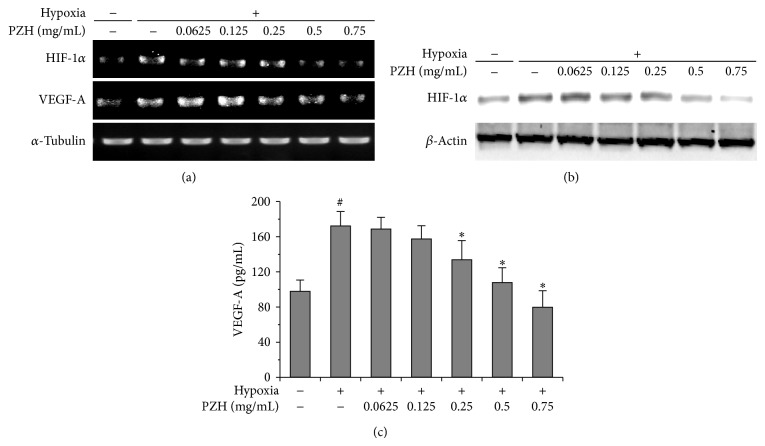
Figure 5.
Effects of PZH on the expression of HIF-1α and VEGF-A in HCT-8. (a) mRNA expression levels of HIF-1α were analyzed by RT-PCR, and α-tubulin was used as a loading control. (b) Protein expression levels of HIF-1α were analyzed by Western blot, and β-actin was used as a loading control. (c) Secreted VEGF protein was analyzed by ELISA. #A significant difference compared with normoxic control (P < 0.05). *A significant difference compared with hypoxic control (P < 0.05).

