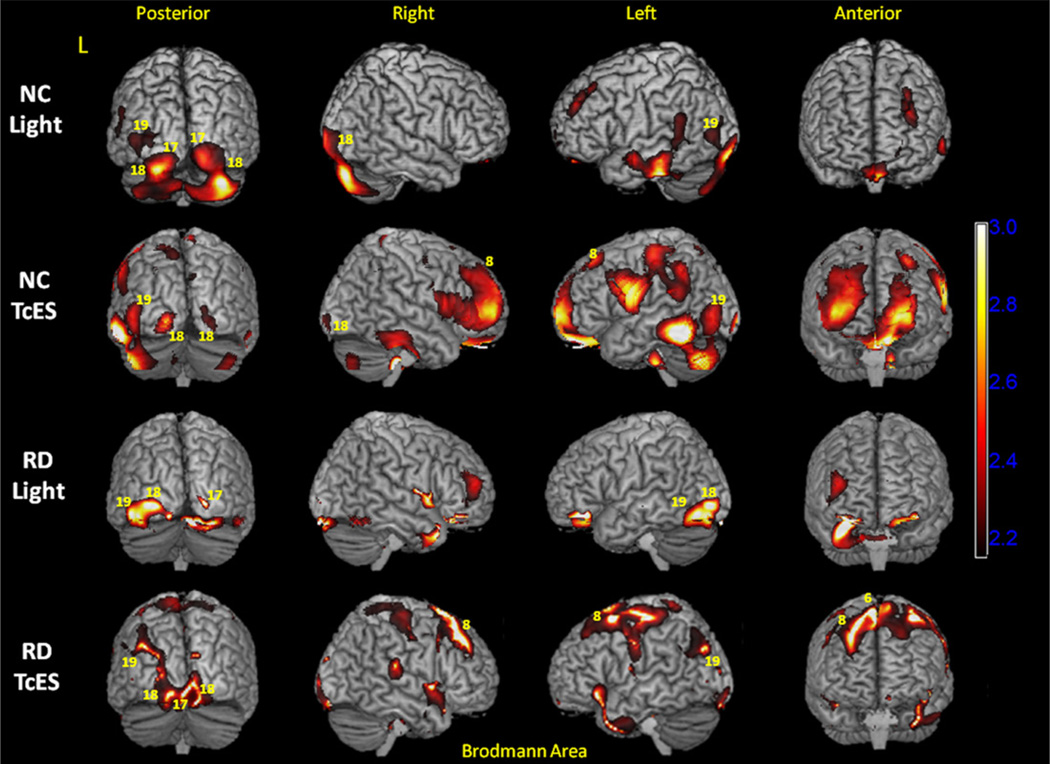
Fig. 4.
3-D statistical parametric map (SPM) projection of light stimulation and transcorneal electrical stimulation (TcES) activation. (Top row) Increase in cortical PET FDG activity compared to baseline (p < 0.05) during light stimulation in normal controls; (Second row) TcES in normal controls; (Third row) light stimulation in retinal degenerative subjects; and (Bottom row) TcES in retinal degenerative subjects. SPM maps are overlaid on top of rendered 3-D MRI brain surfaces. Selected Brodmann areas that exhibit increased activity during stimulation conditions are labeled as yellow numeric values. Scale bar = t-value. L: left hemisphere; NC: normal controls; RD: retinal degenerative subjective.

