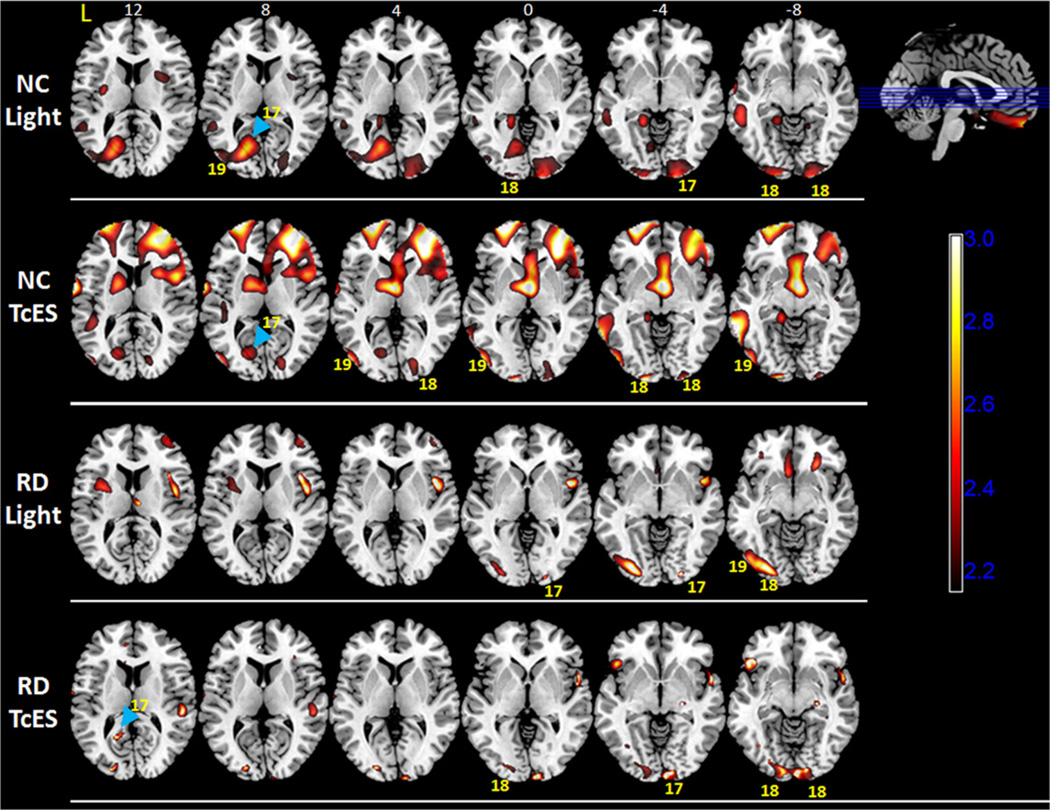
Fig. 5.
Statistical parametric maps for normal controls and retinal degenerative subjects overlaid on transverse MRI template, (Top row) showing areas of increased PET FDG brain activity compared to baseline (p < 0.05) during light stimulation in normal controls, (Second row) during transcorneal electrical stimulation (TcES) in normal controls, (Third row) during light stimulation in RD subjects, and (Bottom row) during TcES in RD subjects. Numerals above the top row of MRI transverse sections denote position in millimeter above (z > 0) and below (z < 0) the plane transecting the anterior and posterior commissures (z = 0). Selected Brodmann areas are labeled as yellow numeric values. Scale bar = t-value. L: left hemisphere; NC: normal controls; RD: retinal degenerative.

