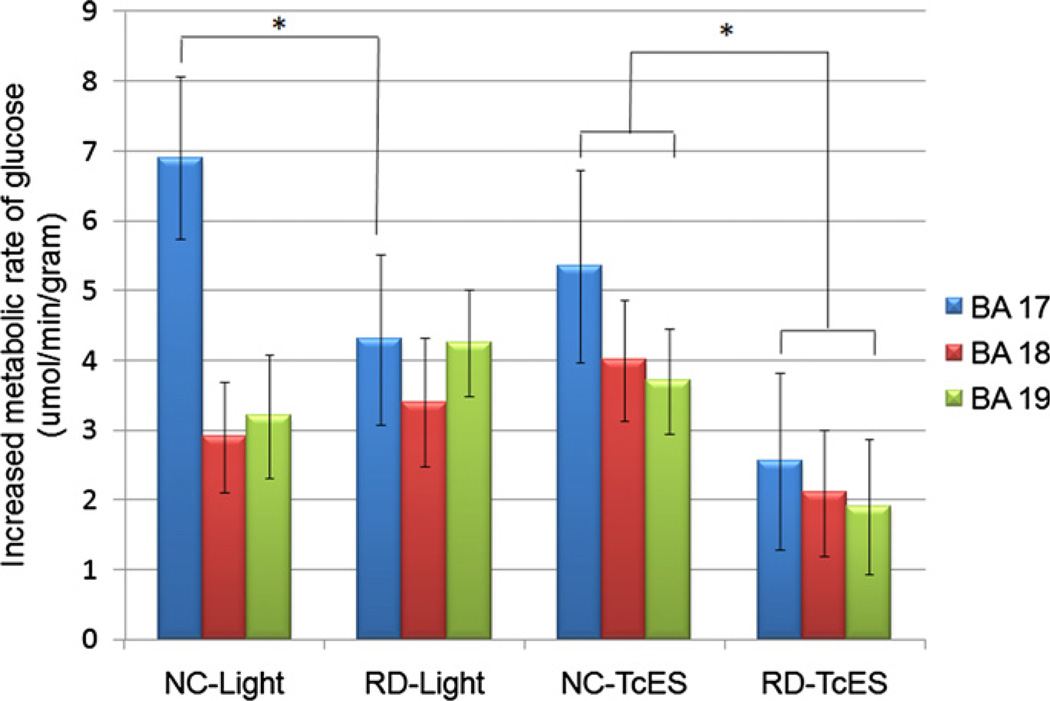
Fig. 6.
Quantitative PET comparison of primary and secondary visual cortex between normal controls and retinal degenerative subjects. Vertical axis represents increases in metabolic rate of glucose compared to baseline, in units of µmol of FDG consumed per minute per gram of brain tissue. BA: Brodmann area; NC: normal controls; RD: retinal degenerative subjects; error bar represents standard deviation; * denotes statistically significant difference between respective columns marked by brackets, p < 0.05.

