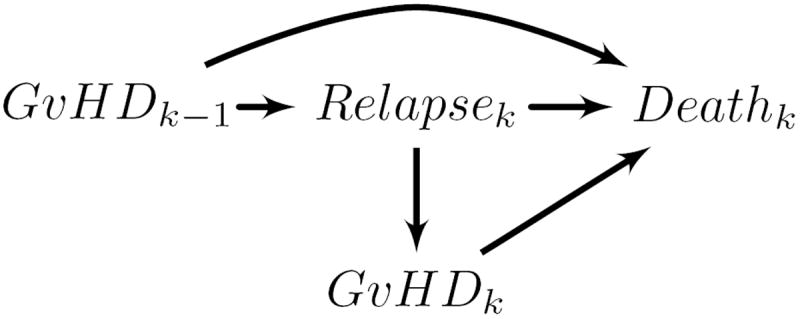
Figure 1.

Directed acyclic graph showing hypothesized causal relationships among study variables for days k − 1 and k. This graph demonstrates bias in regression stratification methods in estimating the effect of exposure over time (GνHDk−1, GνHDk) on subsequent death when time-varying factors on confounding pathways (Relapsek) may be affected by prior exposure.
