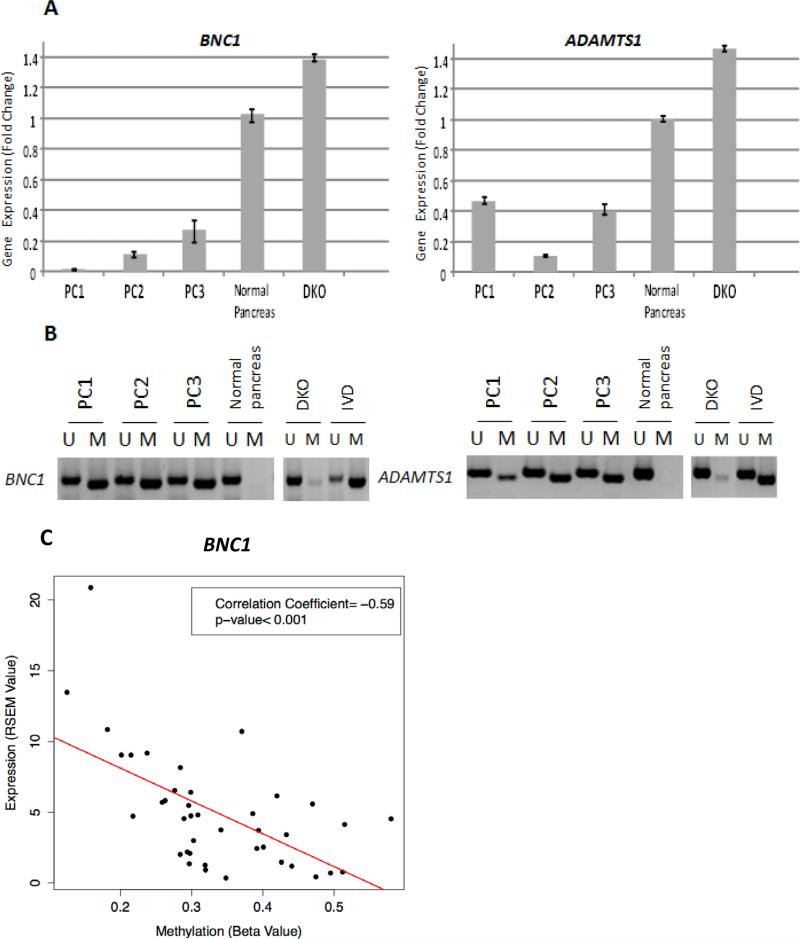
Fig. 4.
Down-regulation of BNC1 and ADAMTS1 gene expression in primary pancreas cancers. (A) Quantitative mRNA gene expression and (B) DNA methylation analysis of BNC1 and ADAMTS1 in pancreas cancers using qPCR and MSP analysis. PC1-3 indicates primary pancreatic cancer samples. Normal pancreas was used as a control. Expression and methylation are matched from each individual samples. MSP analysis, signals for unmethylated (U) and methylated (M) DNA are shown for each sample. IVD= in vitro methylated DNA. DKO=double knockout HCT116 cells (DNMT1−/− and DNMT3b−/). C) Correlation between methylation and expression in 41 samples from The Cancer Genome Atlas for BNC1. The solid line indicates the linear regression model for all points.

