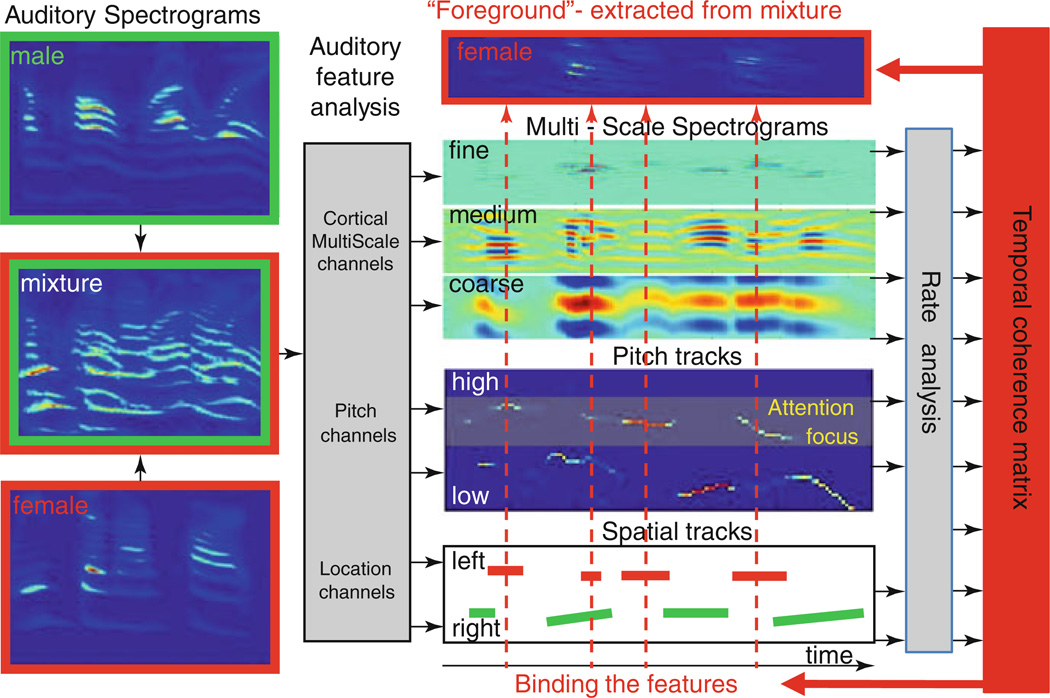
Fig. 59.1.
Temporal coherence model. The mixture (sum of one male and one female sentences) is transformed into an auditory spectrogram. Various features are extracted from the spectrogram including a multiscale analysis that results in a repeated representation of the spectrogram at various resolutions; pitch values and salience are represented as a pitch-gram; location signals are extracted from the interaural differences. All responses are then analyzed by temporal modulation band-pass filters tuned in the range from 2 to 16 Hz. A pair-wise correlation matrix of all channels is then computed. When attention is applied to a particular feature (e.g., female pitch channels), all features correlated with this pitch track become bound with other correlated feature channels (indicated by the dashed straight lines running through the various representations) to segregate a foreground stream (female in this example) from the remaining background streams

