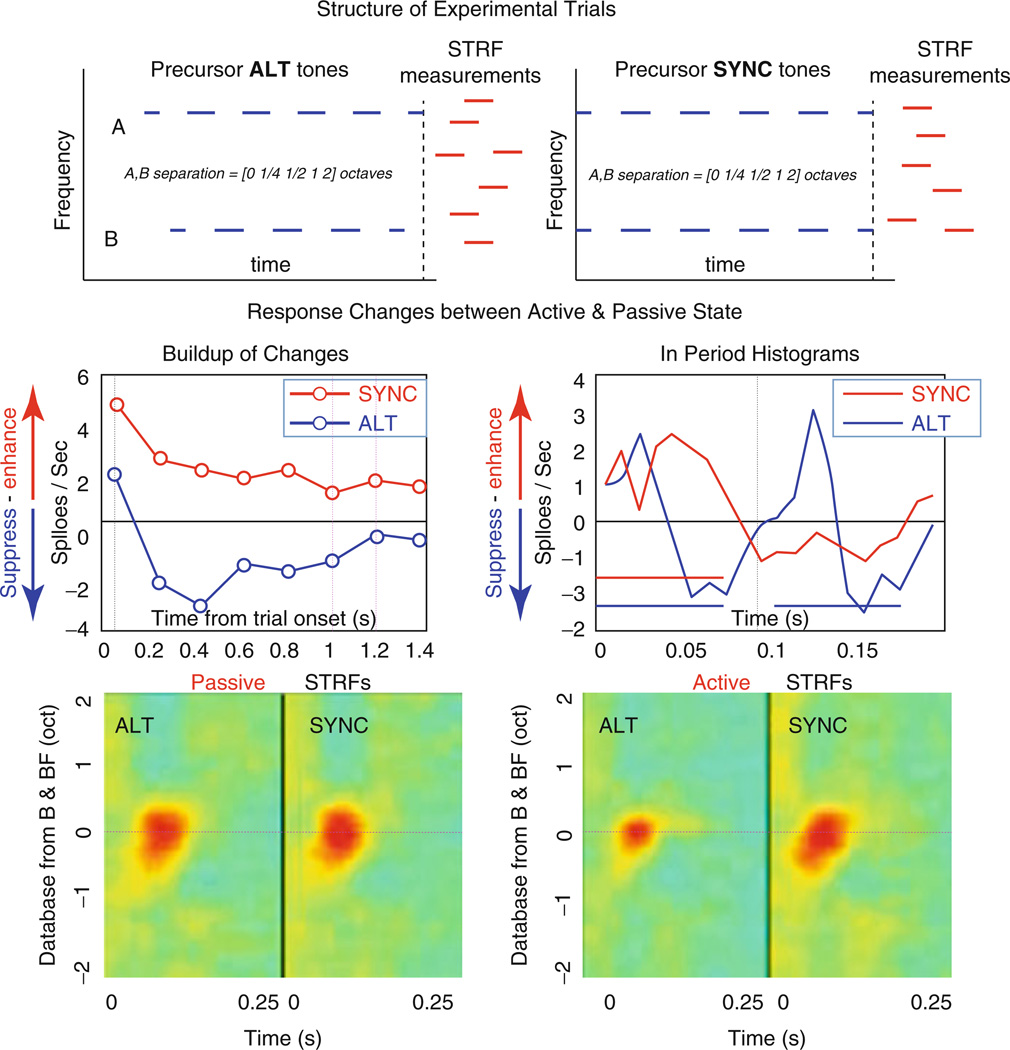
Fig. 59.3.
Behavioral neurophysiology. (Top Panels) Structure of experimental trials. Ferrets listened to ALT or SYNC tone sequences presented for 1–3 s followed by a cloud of random tones (red) used to measure the STRF of the recorded neuron. (Middle Panels) Responses change when animals begin to listen attentively and globally to all tone sequences, i.e., not selectively to one tone. The responses become enhanced for the SYNC sequences (red) and attenuated for the ALT sequences (blue). Response changes (left panel) start immediately after onset of the trial but reach a plateau after three to four tone bursts (~0.5 s). Period histograms of responses to the tones (red and blue bars in right panel) reveal that SYNC tone responses (red) become significantly enhanced, while those of ALT tones become suppressed (blue). (Bottom Panels) STRFs measured at the end of tone sequences during the passive state show very little differences (left panel). During active attentive listening, STRFs become depressed after ALT compared to SYNC tone sequences (right panel)

