
Figure 1.
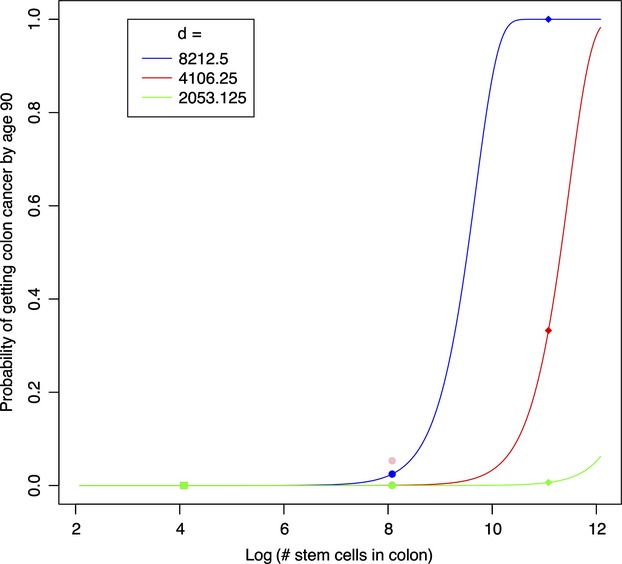
Estimated probability of colon cancer development in mouse (square), human (circle), and whale (diamond) characterized by different number of stem colon cells and the same number of stem cells divisions (d) for each animal (blue line). Red and green line indicate this estimation with number of stem cells divisions lowered by two and four, respectively.