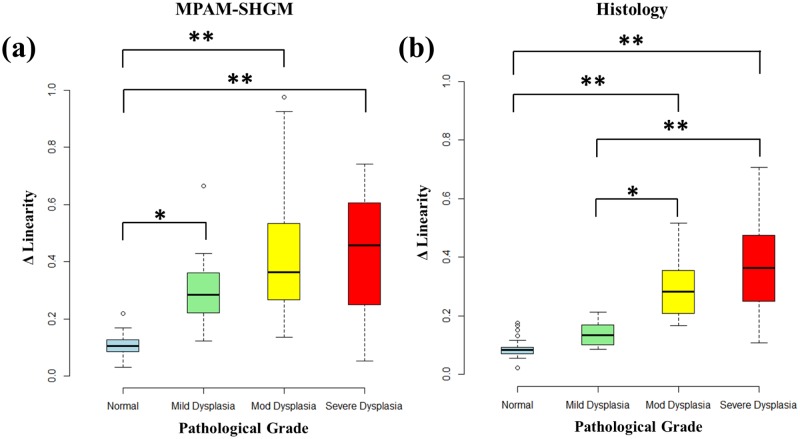
Fig 6. ΔLnorm measurements from MPAM-SHGM (a) and histology (b) show statistically significant increase in ΔLinearity of mild, moderate and severe dysplasia from normal mucosa.
Box plot analyses show the median, 25th and 75th percentiles, and outliers for both MPAM-SHGM and histology. “*” and “**” represent statistical difference between groups at p< 0.05 and 0.01 significance respectively.

