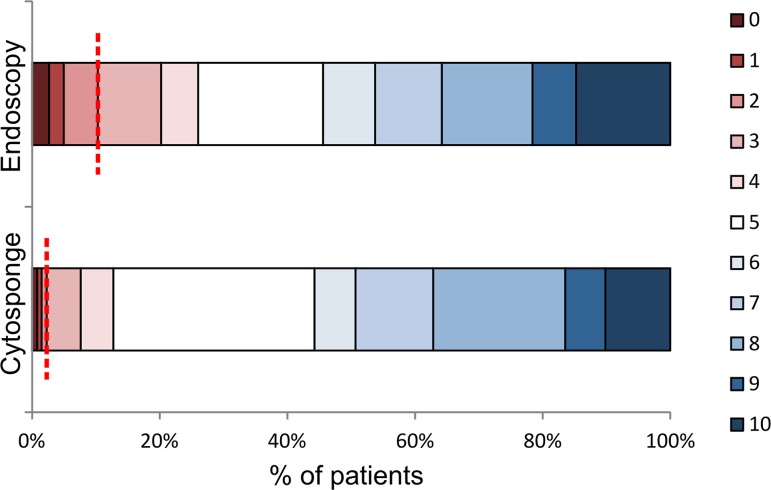
Figure 2. Acceptability of endoscopy and the Cytosponge test.
Patients were asked to rate the procedures using a visual analogue acceptability scale after swallowing the Cytosponge and after endoscopy. The colors representing the different acceptability scores are shown on the right-hand side, with 0 representing the worst experience ever, 5 representing a neutral experience, and 10 representing the best experience ever. The dotted red line marks the boundary between mildly unpleasant or worse (left of the line, score of 0–3) and acceptable scores (right of the line, score of 4 or more), for ease of comparison between the two procedures.

