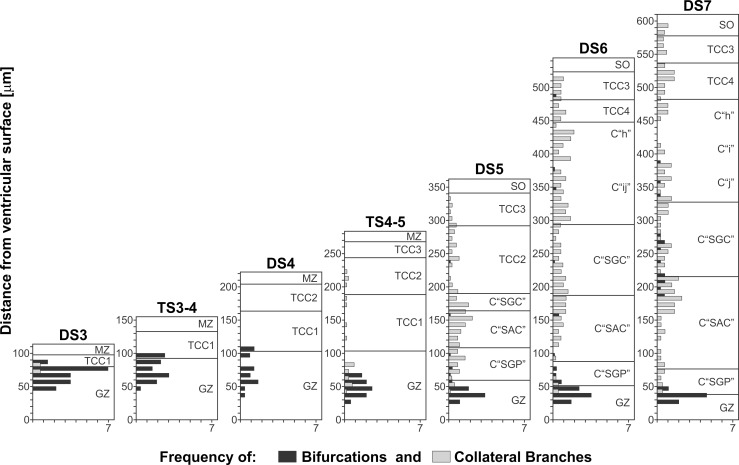
Figure 14. Changes in the local density of lateral branches and bifurcations as a function of both the position along the radial axis (y axis = distance from the ventricular surface) and the DSs.
Each horizontal bar represents the density of lateral branches (gray bars) and bifurcations (black bars) calculated within 0.01 mm2 spatial windows distributed along the radial axis (Windows measure: 10 micrometer along the radial axis * 1 millimeter along the cephalic-caudal axis ). As NE cells proliferation decreases and postmitotic neurons leave the generation zone (GZ) and the premigratory zone (PMZ), the density of bifurcations (black bars) decreases. This change is associated with the disappearance of the PMZ and the decrease in cell proliferation at the GZ. During DS1-DS4 the OT wall irrigation depends on the primitive radial vessels. From DS4 onwards, different populations of new lateral branches appear at positions determined by the appearance of new TCCs.

