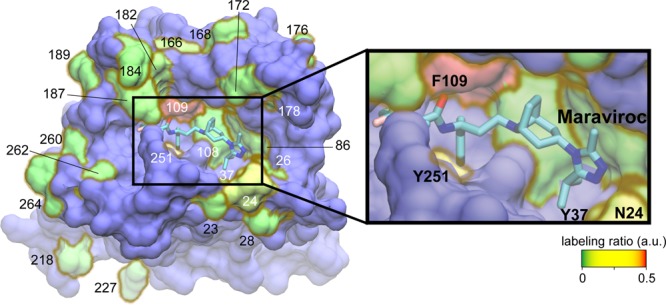
Figure 4.

Surface representation of the CCR5–maraviroc complex (Protein Data Bank entry 4MBS(68)) with an inset showing a close-up of the binding pocket of maraviroc. Four sites (N24, Y37, F109, and Y251) identified to have high DBCO-FLAG reactivity are shown, and maraviroc is depicted as sticks (cyan, carbon; blue, nitrogen; red, oxygen). Site F96 initially used for optimization of the multiplex detection strategy is not visible in this view of the receptor. The color bar indicates the degree of DBCO-FLAG labeling reactivity from nonreactive sites (green) to highly reactive sites (red). Residues not tested in this study are color-coded in blue. This molecular graphic was prepared with VMD version 1.9.1.71
