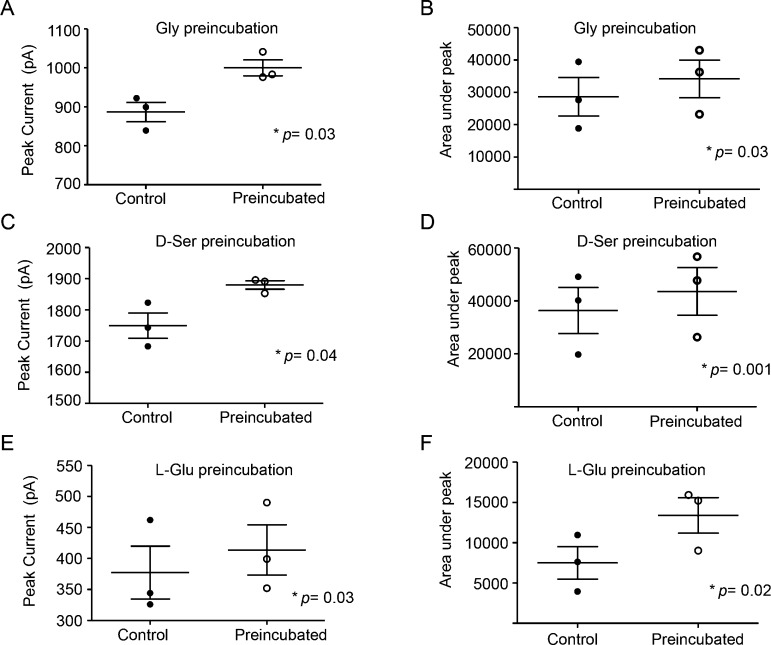
Figure 7.
Comparison of NMDA-induced current peak amplitudes, as well as the area under the current peak between the control and coagonist preincubated samples. (A, B) Gly preincubation, (C, D) d-Ser preincubation, (E, F) l-Glu preincubation. p values obtained from paired t-tests in each case are shown.

