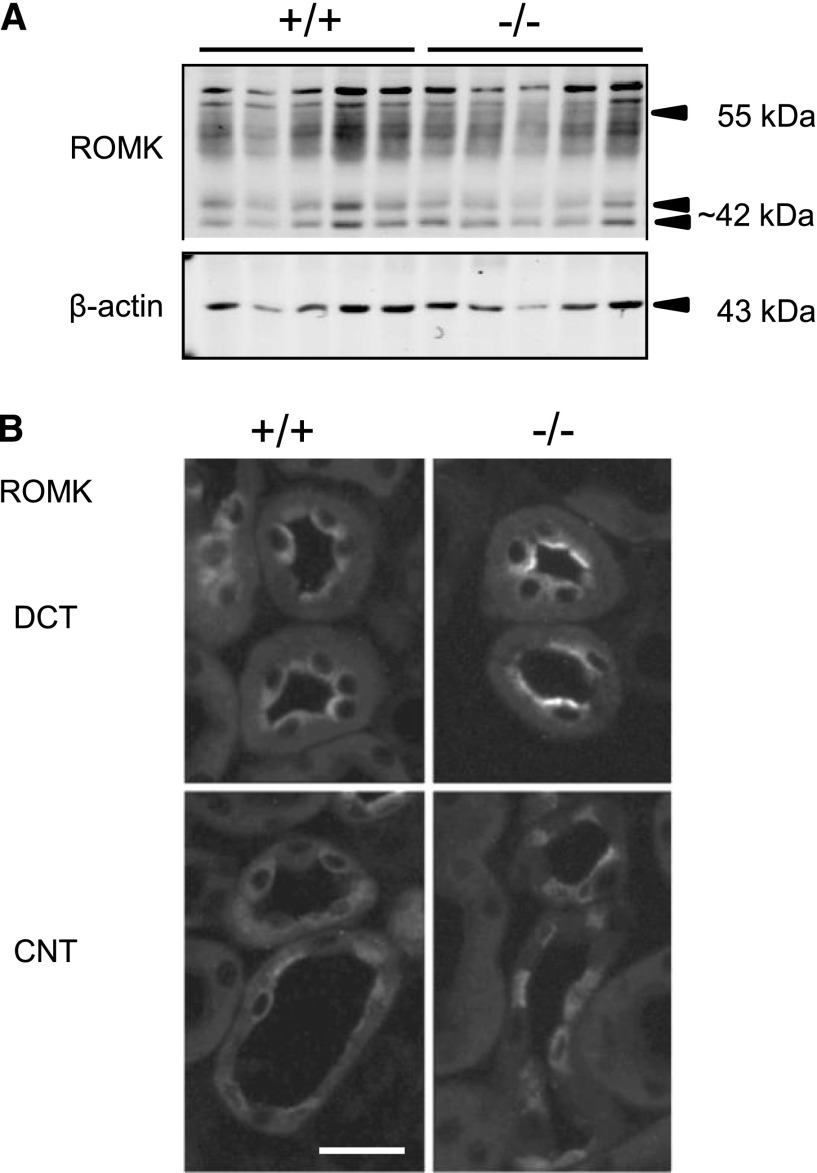
Figure 2.
Expression and subcellular distribution of the ROMK in kidneys of AS+/+ and AS−/− mice kept on a 2% K+ diet for 48 hours. (A) Detection of fully and nonmature-glycosylated ROMK channels (55 kDa and approximately 42 kDa bands, respectively) by immunoblotting using total membrane fractions of whole kidney homogenates. The membrane is reprobed for β-actin. n=5 mice per group. (B) Detection of ROMK channels in DCTs and CNTs by immunofluorescence on kidney cryosections. Tubules are identified by costaining for calbindin D28K (not shown) as described in the Concise Methods. Bar, approximately 25 μm.

